Auto-Analysis7.2 (AA) is the processing
stage that starts from SPD, corrects for all instrumental effects
lasting longer than one reset interval and generates sets of spectra,
fluxes (in Jy) against wavelength (in ![]() m). It applies further
corrections to the slope data to transform it into fully calibrated
astronomical data. These spectra are generated irrespective of the
observation specifications. Figure 7.6 gives an
overview of AA processing. Most of the SWS AA processing steps are
independent of AOT number as most of the special options (e.g. reference scans)
are used in several different AOTs and thus are implemented as part of
the main processing flow.
m). It applies further
corrections to the slope data to transform it into fully calibrated
astronomical data. These spectra are generated irrespective of the
observation specifications. Figure 7.6 gives an
overview of AA processing. Most of the SWS AA processing steps are
independent of AOT number as most of the special options (e.g. reference scans)
are used in several different AOTs and thus are implemented as part of
the main processing flow.
These steps are described in more detail in the following pages.
The data and header information are read from the input SPD. Contrary to the ERD, where we needed to read in several files, in this stage all information is contained in the SPD. The AOT number, needed for the further processing of the data, is determined from the EOHAAOTN keyword in the SPD FITS header. The spacecraft's heliocentric velocity, and, for SWS01s, the scan speed, are also obtained.
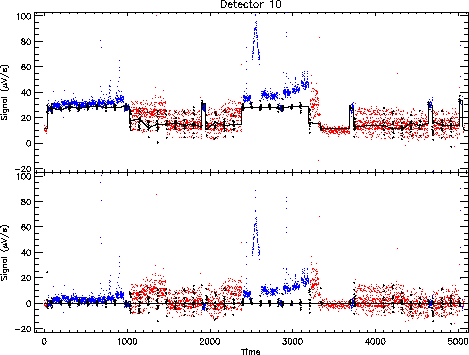
As the first few samples of dark current measurements may suffer from memory effects, or unknown shutter status, the first three datapoints of dark currents for bands 1, 3, 4, 5 and 6 are rejected at this processing step. This is all that is currently done for transient correction in bands other than band 2. We have seen no transient problems in bands 1 or 3. In bands 4, 5 and 6 they are certainly present but no other correction is available. Band 2 transients are treated as changing dark currents, see Section 7.3.3.2.
For each observation dark currents are subtracted in all bands for all detectors separately. In band 2 a different dark current model is used than in the other bands because of the transient effects present there and because a model is available which can actually handle these transients.
For every block of dark current data, the median of valid dark current data is calculated. For every non-dark current scan two dark blocks are selected, one immediately before and one immediately after the scan, which have the same gain and reset lengths as the scan. All AOTs are devised such that this is the case. A linearly interpolated slope connecting the medians of both darks is subtracted from the scan.
In few cases only one dark current block can be associated with a scan. If so, the median of this block is subtracted from the scan. In even fewer cases there is no valid dark current associated with the scan. Then the mean value of all dark currents in the observation with the same gain and reset is used. If there is no valid dark current at all with the same gain and reset length the block is flagged as having no data.
For the photometric checks only the dark current preceding the measurement is subtracted. The calculated dark current values are also subtracted from the dark current frames. The effect on the data of one of the band 1 detectors is shown in Figure 7.7.

|
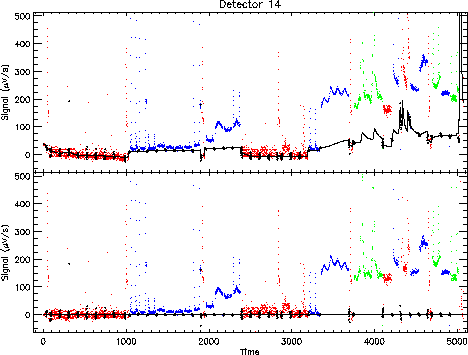
The Fouks-Schubert model, as described in more detail in Section 9.2.1, is used to calculate the varying dark current for the band 2 detectors.
Here ![]() is the signal through the detector at time
is the signal through the detector at time ![]() ,
,
![]() is the relaxed signal at time
is the relaxed signal at time
![]() . It is
proportional to the incoming flux.
. It is
proportional to the incoming flux. ![]() is a constant, representing
the instantaneous increase at a flux step, and
is a constant, representing
the instantaneous increase at a flux step, and
![]() comprises
the memory effects.
comprises
the memory effects.
![]() is dependant on its previous value,
is dependant on its previous value,
![]() , on the present relaxed signal,
, on the present relaxed signal,
![]() , and on
the constants
, and on
the constants ![]() and
and ![]() .
. ![]() is the duration of the
time step from
is the duration of the
time step from ![]() to
to ![]() .
. ![]() is the zero level function which
represents the level to which the signal would decay
when no flux is entering
the system. The signal is related to the relaxed
signal (or flux) via a constant gain
is the zero level function which
represents the level to which the signal would decay
when no flux is entering
the system. The signal is related to the relaxed
signal (or flux) via a constant gain ![]() and a changing dark
current
and a changing dark
current ![]() . This changing dark current is subtracted from the data.
. This changing dark current is subtracted from the data.
The model described in Equations 7.10 and
7.11 is used with a fixed value for ![]() = 0.82 and
= 0.82 and
![]() = 63 V
= 63 V![]() ; they are material parameters verified to be
constant over the mission. For every observation the zero-level
function and the starting value for
; they are material parameters verified to be
constant over the mission. For every observation the zero-level
function and the starting value for ![]() had to be estimated anew.
They depend on the flux history as seen by the detectors.
had to be estimated anew.
They depend on the flux history as seen by the detectors.
The effect on the data of one of the band 2 detectors is shown in Figure 7.8.

|
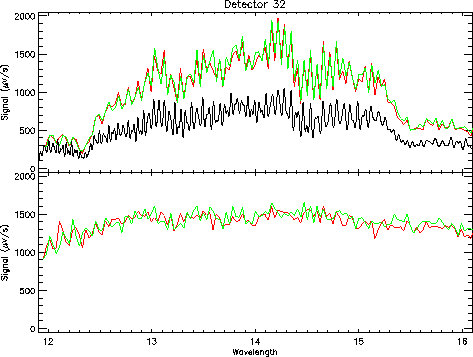
A Relative Spectral Response Function (RSRF) has been determined for every band (Section 5.4). It provides the relative response of the instrument as a function of wavelength. They are stored in calibration files Cal-G 25_xx, where `xx' is the band designation.
For each band the wavelength dependent responsivities are normalised with respect to the key wavelength. This is done per detector. The signals that belong to a certain band are then divided by the normalised responsivities for that band at the corresponding wavelengths. An example of this is shown in Figure 7.9.
Additionally, for SWS01s the responsivities are smoothed by carrying out a flux conserving interpolation to the SWS01 resolution. These factors depend on both the AOT speed and on the band as well as on wavelength, and are stored in the calibration file Cal-G 19.

|
The flux calibration comprises three processing steps,
which can be done in any
order. Flat-fielding brings all detectors to one level. Photometric
check removes long term drifts and flux conversion scales the ![]() V/s
into Jy.
V/s
into Jy.
In the
SWS grating scans, a spectral segment is observed with 12 separate
detectors at any one time. In general, these detectors must be
individually calibrated such that the resulting spectra from each
detector within an AOT band gives the same signal. It was initially
recognized that the signal-to-flux calibration per detector formally
takes care of the flat-fielding. However, the responsivity of an
individual detector relative to the average of the 12 detectors from
the same band was found to be quite stable during the mission as
determined from ![]() 1000 observations, see Section
5.6. Therefore, an independent flat-fielding
measure was introduced into the pipeline to bring the response of each
detector in agreement with the average of all the detectors within an
AOT band
1000 observations, see Section
5.6. Therefore, an independent flat-fielding
measure was introduced into the pipeline to bring the response of each
detector in agreement with the average of all the detectors within an
AOT band
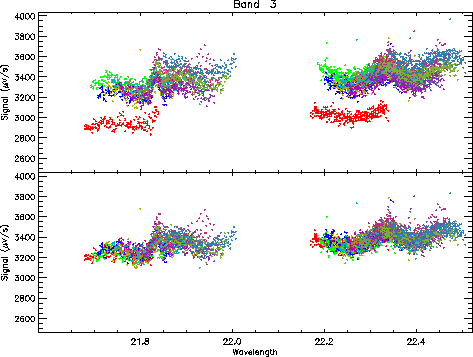
The gains of a single detector compared with the average of all detectors in the band are stored in the calibration file Cal-G 43. This flat-fielding step applies a scaling based on Cal-G 43 and results in all detectors being placed on the same scale as an average detector. An example of flat-fielding is shown in Figure 7.10.
Although additional flat-fielding is usually performed in post processing, the application of a separate flat-fielding step here aids in removing some of the ambiguity of applying either a scaling or an offset correction. As treated in the pipeline processing, the flat-fielding is always a scaling correction. In post processing it might still be necessary to account for offsets introduced through the dark current subtraction.

|
For almost every observation a photometric check is performed using one of the internal stimulators to correct for any long term drifts of detector sensitivity, assuming that all signal changes can be traced to changes in the detectors and that the illuminator itself is constant. The wavelength calibrator was used for this purpose because its flux level was more appropriate. The wavelength calibrator source is scanned over some 20 LVDT steps.
Stimulating the band 1 detectors, however, required a high setting of the calibrator which resulted in significant memory effects in bands 2 and 4. This was noted early in the mission. Photometric checks of band 1 were seen to be quite stable so the photometric check with the high setting was discontinued in revolution 64. Band 1 was periodically monitored throughout the mission with strong illuminator flashes to guard against any possible detector changes. No change was noticed.
The detector signals during the photometric check are compared to the average photometric check over the mission, held in the calibration file Cal-G 41. The signal response is corrected based on an average photometric signal contained in Cal-G 41, see Section 5.5 for more information.
The 6 numbers that are found for the photometric gains are listed in the header of the SPD (to be copied later to the AAR header) under the keywords PHOT_BD*, where `*' is a number indicating the band.
Once the signal, for each band, has been calibrated to a standard time by
the photometric check, and to a standard detector using the flat-gain,
it can be converted from ![]() V/s to Jy/s.
These conversion factors are held in the calibration file Cal-G 42.
V/s to Jy/s.
These conversion factors are held in the calibration file Cal-G 42.
The effect of this processing step is shown in Figure 7.11
![\rotatebox {90}{\resizebox{!}{12cm}{\includegraphics*[2cm,0cm][12cm,25cm]
{fluxcon.ps}}}](img288.gif)
|
The velocity component (![]() ) in the line of sight towards the target, due to
the combined motions of the spacecraft and of the Earth is corrected for in
this module. This then ensures that the AAR
wavelength is heliocentric.
) in the line of sight towards the target, due to
the combined motions of the spacecraft and of the Earth is corrected for in
this module. This then ensures that the AAR
wavelength is heliocentric.
All good data (wavelength, fluxes etc.) are sorted to wavelength and written out to a FITS file. Data for which no wavelength was assigned in Derive-SPD are skipped. The resulting file is a FITS AAR file. For a definition of this file see Section A.4.1, and an example AAR file from an SWS01 observation is shown in Figure 3.5.