|
This section presents a description of how the RSRF was measured during the Instrument Level Tests (ILT) (Feuchtgruber 2001, [9]) before launch, and how it was corrected based on in-orbit measurements of stellar calibration sources. The accuracy of the RSRF calibration is indicated and the remaining artifacts are discussed. More information on the calibration of the RSRF can be read in Vandenbussche et al. 2001, [41], and Vandenbussche 1999, [40].
Prior to launch, the RSRF was determined during the instrument level tests. The measurements consisted of SWS spectra of a cryogenic blackbody calibration source at full spectral resolution, fully sampled in every detector. The calibration source fully filled the SWS apertures. Several scans were performed through the different SWS apertures and with blackbody temperatures ranging between 30 and 300 K. The spectra obtained were then divided by a Planck function of the corresponding blackbody temperature to obtain the RSRF. Figure 5.1 illustrates this calibration process.

|
After launch, the accuracy of the ILT RSRF was verified by comparing SWS observations to synthetic spectra, composite spectra or template spectra for various sky calibration sources. This comparison revealed both broadband errors and small-scale errors.
Figure 5.2 shows the broadband differences between a composite spectrum by Cohen et al. 1992a, [2], and an SWS observation of Sirius.


|
Several effects e.g., differences in nature of calibration sources (extended vs point source), leaks in laboratory setup filters, diffraction losses and uncertainties or small drifts in the blackbody temperature, are responsible for the broadband errors in the pre-launch RSRF.
The SWS RSRF has been corrected for broadband differences between in-orbit observations and reference spectra, except for band 4, see Section 5.4.5.4. The quality of this correction improved in the course of the project as more SWS spectra of calibration stars were observed and the reference spectra available became more accurate.
Fitting polynomes to the residues was clearly not optimal for the variety of shapes present in the residues. The problem with polynomial fits is that a local bias always translates to a global bias, e.g. strong oscillations in the high-order components of a polynomial fit to noisy data. Therefore a method of smoothing the residues with a cubic spline was adopted.
A spline function ![]() of order
of order ![]() with knots
with knots ![]() ,
, ![]() is a
set of functions
is a
set of functions ![]() ,
, ![]() that are defined over the intervals
[
that are defined over the intervals
[![]() ,
,![]() ], ... [
], ... [![]() ,
, ![]() ] and stitched together in the knots
so that the combined function
] and stitched together in the knots
so that the combined function ![]() is
is ![]() times continuously
differentiable at the knots. The functions
times continuously
differentiable at the knots. The functions ![]() are often cubic
polynomes (n=3).
are often cubic
polynomes (n=3).
Späth et al. 1995, [36], describes various algorithms to
smooth
a dataset using splines. An algorithm has been adopted to smooth a dataset
(![]() ,
, ![]() ),
), ![]() by determining a cubic spline
by determining a cubic spline ![]() for which
for which
![]() ,
, ![]() .
. ![]() are weights for the
datapoints and
are weights for the
datapoints and ![]() is a parameter for the smoothness in knot
is a parameter for the smoothness in knot ![]() .
.
![]() and
and ![]() are combined into one knot parameter
are combined into one knot parameter ![]() . Varying
this parameter in a knot will result in a smoothing spline which is more
'stiff' or which follows the dataset more accurately in that region.
. Varying
this parameter in a knot will result in a smoothing spline which is more
'stiff' or which follows the dataset more accurately in that region.
Cubic spline smoothing allows to make the correction curve follow the features in the residues where they are understood to be instrumental. In regions where the residues are believed to be unreliable (less accurately modelled features in the synthetic spectra, etc...) the spline smoothing curve is forced to be more 'stiff'. Therefore it is necessary that one understands the strong and weak points in the reference spectra and datasets used.
This method was implemented for every band and every detector as
follows: for a selected set of calibration sources and reference spectra
we calculated ratios (observation/model). The ratios are averaged
over bins of
![]() =200).
=200).
The data points in the average ratio are then taken as the knots for a cubic spline smoothing. The local stiffness of the smoothing spline is tuned in an Interactive Analysis widget tool, and the resulting spline is then evaluated in the wavelengths sampled in the ILT RSRF. These factors are multiplied with the responses in the ILT RSRF to obtain the corrected RSRF.
After carefully studying many sources observed by the SWS, four features
in the residues (9-9.3, 10.1, 11.0 ![]() m in band 2C and at 12.3
m in band 2C and at 12.3 ![]() m in
band 3A) were understood as inaccuracies in the RSRF, e.g. the result of
a strong memory effect while scanning over a feature in the RSRF during
the ILT tests. Therefore, the smoothing spline was allowed to be less strict
in this region following the shape of the knots.
m in
band 3A) were understood as inaccuracies in the RSRF, e.g. the result of
a strong memory effect while scanning over a feature in the RSRF during
the ILT tests. Therefore, the smoothing spline was allowed to be less strict
in this region following the shape of the knots.
The calibration sources were selected to cover a wide diversity in
spectral types. This allowed the avoidance of biases to spectral
features typical for different spectral classes. The RSRF used in the
processing of the ISO Data Archive (OLP Version 10.1) has been
corrected using the stars in
Table 5.1. For the shortest
wavelength section (![]() 4
4 ![]() m and band 5.3-6
m and band 5.3-6 ![]() m)) we used
synthetic spectra based on MARCS models by Decin 2000,
[4]. For bands 2A and 2C only sources with spectral type G9 and earlier were used. For the long-wavelength section, composites by Cohen et al. 1992a, [2] were used. Composites are pieces of synthetic spectra and real data spliced to photometric points.
m)) we used
synthetic spectra based on MARCS models by Decin 2000,
[4]. For bands 2A and 2C only sources with spectral type G9 and earlier were used. For the long-wavelength section, composites by Cohen et al. 1992a, [2] were used. Composites are pieces of synthetic spectra and real data spliced to photometric points.
Due to a lack of suitable observations (i.e. a decent S/N) of calibration
targets with a well known energy distribution in the region 30-45 ![]() m,
no correction was applied on the RSRF for band 4.
m,
no correction was applied on the RSRF for band 4.
| Source | HR | Spectral type | Wavelength range [ |
|
|
HR 7001 | A0V | 2.3 - 30 |
| HR 2491 | A1V | 2.3 - 30 | |
| HR 4534 | A3 V | 2.3 - 4 | |
| HR 2326 | F0 II | 2.3 - 12 | |
| HR 5459 | G2 V | 2.3 - 30 | |
| HR 7310 | G9 III | 2.3 - 12 | |
| HR 5340 | K1.5 III | 2.3 - 4, 5.5 - 7, 10 - 30 | |
| HR 6688 | K2 III | 2.3 - 4, 5.5 - 7, 10 - 12 | |
| HR 5563 | K4 III | 2.3 - 4, 5.5 - 7, 10 - 12 | |
| HR 6705 | K5 III | 2.3 - 4, 5.5 - 7, 10 - 30 | |
| HR 1457 | K5 III | 2.3 - 4, 5.5 - 7, 10 - 30 | |
| HD 149447 | HR 6166 | K6 III | 2.3 - 4, 5.5 - 7, 10 - 12 |
| HR 337 | M0 III | 2.3 - 4, 5.5 - 7, 10 - 30 | |
| HR 911 | M2 III | 2.3 - 4, 5.5 - 7, 10 - 30 | |
| HR 8775 | M2.5 III | 2.3 - 4, 5.5 - 7, 10 - 30 |
As mentioned in Section 5.4.3, several features in the ILT RSRF of band 2C and one feature in band 3A were understood to be artifacts. Although the RSRFs have been corrected for these features, residues of them can remain in these wavelength regions.
The wavelength regions that therefore deserve special care are:
| Band 2C: | 9-9.3 |
| Band 2C: | 10.1 |
| Band 2C: | 11.0 |
| Band 3A: | 12.3 |
All spectral bands of the SWS show fringing caused by one or multiple sets of parallel surfaces in the lightpath that act as a Fabry-Pérot system. The most obvious fringe pattern is seen in band 3 where the Fabry-Pérot effect is caused by the BIBIB detectors themselves.
Order selection filters cause fringing in bands 1 and 2. Compared to the fringes in band 3, the situation is less severe - the amplitude is smaller and the fringe frequency higher, close to the wavelength resolution of the SWS in those bands.
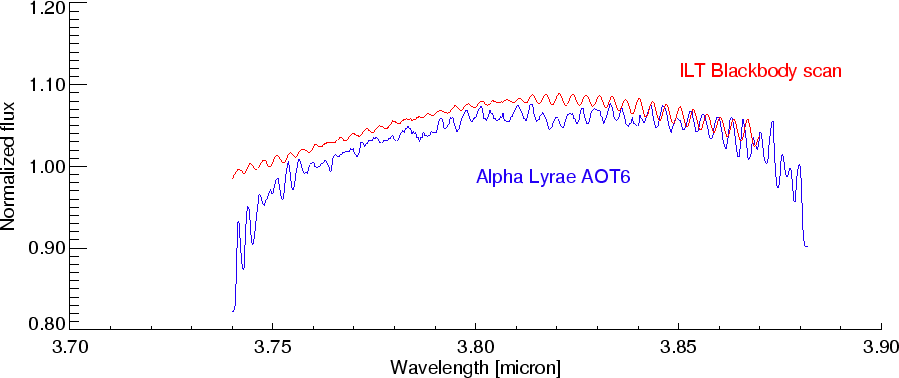
The fringes in bands 3 were also observed during the instrument level tests (Section 5.4.1) so they are also present in the RSRF and will be divided out in the final SWS spectra. However, the beam from the source used during the pre-launch measurements filled the slit of the SWS entirely. Therefore the RSRF measured during these tests has a slightly lower spectral resolution than in-orbit observations of point-like sources. That is the reason why the fringes seen in band 3 are sharper in observations of point-like sources than in the RSRF. Slight pointing errors will also result in a wavelength shift of the spectrum observed, so that the fringes can be shifted slightly with respect to the fringes in the RSRF. This will result in large fringe residues in the spectra in bands 3A, 3C, 3D and 3E. Within the OSIA and ISAP packages, interactive processing tools are available to deal with the residual fringes (Kester, Beintema & Lutz 2001, [21]). See also Section 9.7.
As illustrated in Figure 5.3 the fringes in bands 1 and 2 are hardly resolved in the RSRF while they are completely resolved in high-resolution SWS spectra of stars. This will often limit the S/N that can be achieved with the ISO-SWS at full resolution in those bands.
 |
The wavelength range of the SWS grating section extends over several
octaves. A set of dichroic beamsplitters and order selection filters
are therefore needed to avoid light from other wavelengths to leak in
via lower or higher spectral orders. The order selection filters in
the light path of band 3D do not cut off the shorter
wavelengths efficiently enough. Band 3D therefore shows leakage from
the wavelength region around 14 ![]() m. Typically about 10% of the
flux at 14
m. Typically about 10% of the
flux at 14 ![]() m will leak to the 28
m will leak to the 28 ![]() m region. The RSRF for band
3D is appropriate for sources that have a relatively low flux at
14
m region. The RSRF for band
3D is appropriate for sources that have a relatively low flux at
14 ![]() m compared to 28
m compared to 28 ![]() m and hence show no leakage. In spectra of
blue sources a false rise at the end of band 3D is seen (Figure
5.4).
m and hence show no leakage. In spectra of
blue sources a false rise at the end of band 3D is seen (Figure
5.4).
Within the OSIA package the RSRF calibration for bands 4A, 4C and 4D is available. These bands contain the data recorded in the band 4 detectors during the scans of bands 3A, 3C and 3D. From the SWS block diagram (see Figure 2.4), it can be seen that there is no order selection filter in the re-imaging optics of the band 4 detectors. For band 4C, this results in very severe leakage from longer wavelengths. Since stellar spectra were used for the RSRF correction, the impact on the RSRF accuracy is minimal. The primary use of this serendipity data is to verify the strength of spectral features in spectra where the band 3 data is problematic due to fringing. In that case one will typically normalise the continuum measured in band 4 to the continuum measured in band 3. The lower sensitivity with respect to band 3 can also be used in the few cases where the SWS observed high flux sources that (partially) saturated the band 3 detectors.
No in-orbit correction of the band 4 RSRF has been applied due to lack of suitable observations/sources. So the RSRF in band 4 is completely based on laboratory measurement using a very bright, extended source. It is known that the laboratory measurements show a strong de-biasing effect, and it can thus be expected that the shape of the current band 4 RSRF has a global inaccuracy of about 10%.
The effect on the final spectrum of subtracting a wrong dark-current value depends on the RSRF in the wavelength region affected. The SWS RSRFs are not flat at all. They show steep slopes at the ends of the bands, and various bands show distinct features in their RSRF. The dark current subtraction has to be done properly for a proper RSRF correction.
Dividing poorly dark subtracted data by the RSRF will induce false shapes in regions where the RSRF shows features or where the RSRF has a steep slope. Poor matches between different bands can often be understood (and corrected for) from such a combination of dark current uncertainties and a steep RSRF in the overlap region.
The figures in the next sections show where the RSRF is steep or shows features and thus where the risk for these artifacts exists. If the signal level of a scan is of similar strength as the dark currents for that band, it is wise to check if discontinuities at band overlaps or features whose position coincides with RSRF features are real or artifacts.
In Figures 5.5 to 5.19 we give an overview of the RSRF for one representative detector in each band. The curve plotted below the RSRF is an empirically determined uncertainty on the broadband shape of the RSRF. These uncertainties were determined by examining a large set of observations processed with the appropriate RSRFs (presented in this section) and compared them to the expected spectrum. As such, they do not contain a formal error, but rather an indication of the regions in the RSRFs which are known to be less reliable than other regions. The places where small-scale corrections to the ILT RSRFs were applied can be recognized by a sudden rise in the uncertainty.
The Fabry-Pérot sensitivity was characterized in instrument levels tests by doing measurements on a calibrated blackbody source within the test cryostat. Figures 5.20, 5.21, 5.22, 5.23 and 5.24 show the SWS Fabry-Pérot spectral response functions.
The spectral response curve has structure on various wavelength
scales. Large scale trends are determined by the counteracting
effects of increasing detector spectral response with wavelength
(until close to the detector cut-off wavelength) and decreasing
transmission of the Fabry-Pérot interferometer. Structures on
scales of microns or tenths of microns can be traced to the detector
spectral response curves and filter transmission curves. A rapid
low-amplitude modulation in the 11.4-16![]() m range is caused by
reflections between the surfaces of the transmission filter used
behind slit 1 in the long-wavelength section of SWS. This
`parasitic Fabry-Pérot' effect is also observed for grating data
using the same slit. The stronger modulation detected at
m range is caused by
reflections between the surfaces of the transmission filter used
behind slit 1 in the long-wavelength section of SWS. This
`parasitic Fabry-Pérot' effect is also observed for grating data
using the same slit. The stronger modulation detected at
![]() 40
40![]() m in the long-wavelength extended range is
again caused by a parasitic Fabry-Pérot effect, this time in a
reflecting
m in the long-wavelength extended range is
again caused by a parasitic Fabry-Pérot effect, this time in a
reflecting ![]() filter. The nearby `reststrahlen' resonance of
filter. The nearby `reststrahlen' resonance of
![]() causes strong variations with wavelength of the indices of
refraction and absorption, leading to the observed modulation
pattern. The modulations were characterized with sufficient accuracy
to allow good flux calibration in the extended wavelength ranges.
causes strong variations with wavelength of the indices of
refraction and absorption, leading to the observed modulation
pattern. The modulations were characterized with sufficient accuracy
to allow good flux calibration in the extended wavelength ranges.
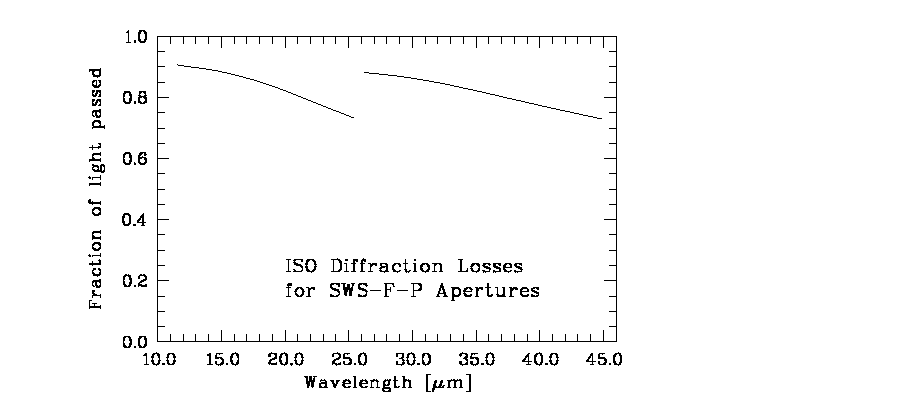
The SWS Fabry-Pérot sub-instrument suffers from diffraction losses caused by the fact that the aperture is comparable in size to the ISO diffraction disk. The effect of these diffraction losses is however not large, and Figure 5.25 shows it as a function of wavelength.

|
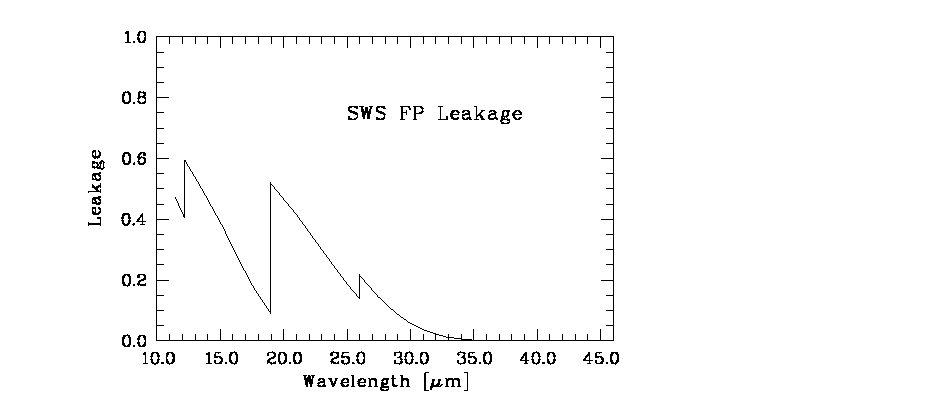
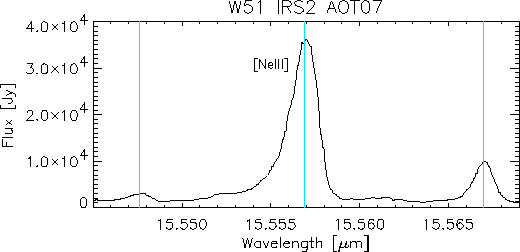
The Fabry-Pérot section uses the grating as an order selector that suppresses unwanted FP orders. This suppression is not complete for part of the SWS wavelength range. Neighbouring FP orders `leak' through the wings of the grating instrumental profile, contributing significantly to the total measured signal (See Figure 5.27). For observations of a single line superposed on a smooth continuum, the only drawback of leakage is a more complicated flux calibration, since leakage will increase the observed continuum but not the line. More serious effects occur in crowded spectra, where strong lines seen in the `wrong' FP order may significantly distort the observed spectrum, requiring observations of wider wavelength ranges in order to determine the severity of this effect and `clean' the spectrum.
Leakage has been quantified by analysis of the grating instrumental profile as seen by the FP detectors in scans of solid state laser lines. Figure 5.26 shows the leakage as a function of wavelength. This figure must be used with caution, since it is based on extrapolating the grating instrumental profile from measurements at only a few wavelengths of laser lines.
Figure 5.27 shows the effect of leakage on a observation of a single line specially planned to observe the leakage. Because the observation was carried out over a large wavelength interval two `ghost' lines appear either side of the real line. Usually these `ghost' lines would not appear in observations, as they cover a much smaller wavelength range. The observed NeIII line is very strong and, as the FP scans from longer to shorter wavelengths, the line appears non-symmetric because of memory effects in the Si:Sb detector. The 2 leaking orders do not have the same intensity because the grating instrumental profile is not centred on the main order. This slight deficiency in the grating wavelength calibration, although within specifications, translates into the non-symmetric pattern.
The spectral response data in Section 5.4.7 have not been corrected for the effects of leakage, i.e. they refer to the total signal.

|

|