3.3) The Data Processing Windows
3.3.1) The PIA ERD Data Display Window
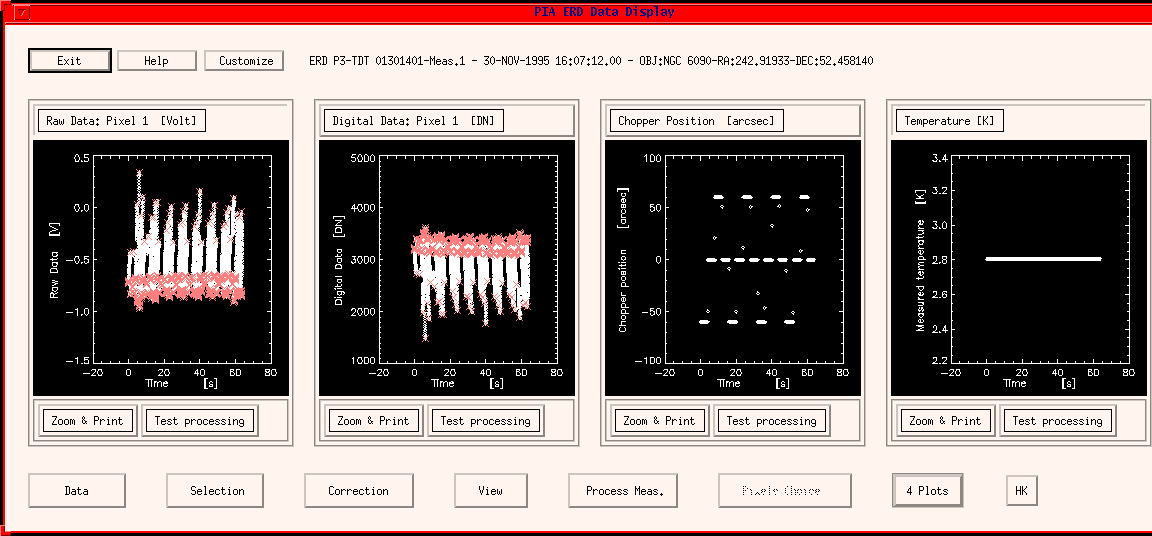
The PIA ERD Data Display Window serves to control the processing from the ERD to the SRD level. This window opens via the button "Plot & Reduce Data" in the menu of the PIA Measurement Buffer Control Panel. The maximal number of opened ERD Windows is restricted to two.This chapter describes the PIA ERD Data Display window and directly associated sub-windows.
Basically the ERD window (Figure 1) is divided into three rows:
- The upper row: It contains control buttons, main measurement information and in the case of a C100 or C200 measurement detector array pixel buttons.
- The middle row: It shows a number of plots (up to 4) and associated buttons, acting on the displayed plots or on the data displayed in the corresponding plot.
- The lower row: It contains several data handling and processing buttons, acting on the whole measurement. It includes a button to chose the number of plots in the middle row.

The upper row
Exit
Closes the window. Note that the actual measurement data remain in the buffer and can be recalled at any time causing this window to pop-up again.Help
Calls the chosen html browser in a background process opening the PIA User Manual, starting with this chapter.Information line
Information about the measurement loaded in the window is given, composed of: level of reduction, detector and TDT number, observation date, object name and coordinates.Customize
Opens the PIA Symbol Choice Menu window in order to select a new default plot symbol type. After a choice has been made ("OK"), the plots in the middle row will be immediately refreshed using the new plotting symbol. Note that the new plotting symbol chosen is then taken as default for all the next main windows and associated zoom windows.Pixel Selection for the detector arrays C100 and C200
For C100 and C200 data the array pixels selected for the plots are indicated in the upper righthand corner of the window in y-z spacecraft coordinates (please note that the coordinates are oriented looking on the array - x-axis pointing towards the observer. The view on the sky is mirrored along the z-axis). The numbers 1-n (n between 1 and 4, depending on the number of views chosen, see N Views) show which of the plots in the large window correspond to which pixels . You may cyclically change the selection for every plot window by directly clicking with the mouse onto the buttons.
The middle row
Plots and Menu Bar on top
The plots display those parameters which are indicated in the menubar on the top of the windows versus the time relative to the start of the measurement. This menu bar pops up a submenu in order to change the content of the plot. The submenu offers the following choice:C100, C200 and PHT-S are equipped with CRE outputs, which are not connected to detector pixels, either open ("Open pixel") or connected to a resistor ("Resistor pixel"), for performing studies on readout electronic effects. For data corresponding to these detectors also following choices are present:
- Raw Pixel Data [Volt]
Main information on this level. The readout output as measured from PHT converted in Volts.- Unconverted Data [DN]
Digitized readout output as coming in the telemetry.- Chopper Position [arcsec]
Measured chopper throw per readout.- Temperature [K]
Detector sub-system temperature.- FCS1 electrical power [mW]
Electrical power applied to the first calibration source.- FCS2 electrical power [mW]
Electrical power applied to the second calibration source.- Time Key
Instrument specific timekey- Raster Point ID
RP-IDs 1 & 2 (index of raster along Y and Z spacecraft axes). Choice is given to the user for plotting the one or the other.- Bit Flags
Flag present in the telemetry containing 6 items. Choice is given to the user for plotting one of them. The items are:
- Suspicious Flag
- Chopper on Position
- Chopper Sign
- Read-out Status
- On-target flag
- Automatic Data Reduction
- Fitted Readout Values [V]
When processing the ERD measurement to the next level, the values of the fitted polynomial are put into this variable. Please note that if processing several times the same measurement, the last fitted readout values are accomodated in the variable. Not active by ramp subdivision.- Readout Flags
PIA internal flags giving the status of every read-out. The flags are organized bitwise and can be seen individually decoded as set or unset. The options are
- Encode
The full integer containing all the flags.- Not on Target
Read-outs recorded outside the target (eg. during a raster sweep to a new position)- Destructive Read
Set for destructive read-outs- Out of voltage
Read-outs marked as product of saturation- General Discard
Read-outs which should not be used for processing according to the general selection's criteria- Manual Discard
Read-outs discarded graphically by the user- Detected glitch
Read-outs flagged by one of the deglitching methods applied.After a selection the new plot will be immediately drawn. By default, for the detectors P1, P2 and P3, where only one single pixel is involved, the n plots show Raw Data, Unconverted Data, Chopper Position and Temperature, in this order and according to N. For the detectors C100, C200 and PHT-S the plots show the Raw Data for four pixels.
- Open Pixel Data [V]
The readout output of the "open pixel".- Resistor Pixel Data [V]
The readout output of the "resistor pixel"."Zoom & Print" Menu Bar below Plots
This menu bar just below each of the plots pop-up a submenu in order to draw the plot in a different window using PIA_Xplot. The submenu offers the following possibilities:
- New: A new PIA_Xplot (s.3.4.1) window will be created.
- Overplot Synchronized: The active PIA_Xplot window will be used accomodating the plot sent and the old active one using one common scale. The different data will be represented by different symbols and colors.
- Overplot Not Synchronized: The active PIA_Xplot window will be used and the new data will be overplotted using own scaling. The different data will be represented by different symbols and colors.
"Test processing" Menu Bar below Plots
This menu bar just below each of the plots calls a submenu with the following options: (Note that the options are applied either on the data actually drawn in the plot, if applicable, or on the "Raw data" corresponding to the selected pixel for this window)
- Fit Ramps: Alternatively 1st-, 2nd- and 3rd-order polynomials can be fitted to the ramps. In addition the ramp sub-division method can be tested on this pixel data. From the fitting results, the linear coefficients of the polynomials with error bars, are automatically drawn on a new PIA_Xplot window. This option applies only to the IR Raw Data.
- Fourier: Performs a Fourier-Analysis. The resulting amplitueds are automatically drawn on a new PIA_Xplot window. Option applicable to any of the variables.
- Average: Computes the simple average and standard deviation of the "y-values" of the plotted variable. The results are shown on a text window.
- Median: Computes median and standard deviation of the "y-values" of the plotted variable. The results are shown on a text window.
- Test Deglitching (single threshold): This brings up the PIA Ramps Deglitching Parameters Window in order to test, modify and/or optimize the deglitching on the ramp level. With this sequence deglitching set-up parameters can be modified and tested with the Raw Data of the pixel selected for this window.
- Test Deglitching (2 threshold method): This brings up the PIA read-out 2 threshold deglitching Parameters menu, which allows to modify and test the parameters driving the 2 threshold deglitcher.
- Discard area graphically: De-selection of points corresponding to the raw pixel data assigned to the window can be performed. For this purpose a special PIA_Xplot window pops up containing the raw pixel data, on which areas can be selected by using the mouse. The data points in these areas will be deselected for further processing.
- Reselect area graphically: Same as former for re-selecting discarded points.
The lower row
Data
This menu bar calls a submenu with the following options:
- Load: This calls the Please select a measurement window (s.3.2.4) in order to load a new measurement from the buffers into the ERD window, activating it for plotting and reduction. The measurement which was displayed still remains in the buffer, but is deactivated from this window.
- Save:
- To ERD buffer: this option can be used for putting the modified data present on the window into the dynamic buffer, together with all the modifications. The same position in the buffer can be used, thus overwriting the data which entered the window, or a new position, creating a new measurement in the general buffer. This allows for a re-call of the corrected data in a later stage, opening again the ERD window.
- To PIA internal file: this calls the Please Select a File for Writing window, which asks for a filename (and directory) under which the data shall be saved (a default name is proposed) in internal PIA format. This gives the possibility of saving several times the same measurement differently corrected, avoiding confusion (several versions in the case of VMS files) or overwriting (in the UNIX case).
If an associated Compact Status file with the appropriate filename is not found in the directory chosen for saving the measurement's file, then the Compact Status data will be automatically saved, also in internal format. This makes possible to reduce the data in a later session without loading the data from the FITS files.
- Show Data: This calls the PIA Show Structures - Plot Curves menu (s.3.4.4) for a complete access to the measurement buffer, allowing for plots, correlations, text file output of buffer variables, etc.
Selection
This menu bar calls a submenu with the single option:
- Discard Read-Outs: This calls the PIA Read-Out Selection Window in order to enter which read-outs shall be discarded.
After selection the plots of the ERD Window will be refreshed with the discarded read-outs being marked by different symbols, depending on the plot symbol style. Note that the selection criteria chosen remain active for all further processing steps within a session until they are modified again. Particularly they affect all the pixels of the array detectors. It is not possible to set the parameters individually for each pixel or a group of pixels.Correction
This menu bar calls a submenu for corrections to be applied to the measurement with the following options:
- Non-Linearity: This performs the non-linearity corrections of the readout ramps.
- Read-out simple Deglitching: This performs the deglitching on the read-out level for all the pixels which belong to the measurement.
- 2-Threshold Deglitching: performs deglitching using the two threshold algorithm for all the pixels which belong to the measurement.
- Reconstruct Ramps: Replaces the voltage jumps to every read-out flagged as a glitch with the average of the valid voltage differences, thus reconstructing the ramp. (This is only for judgement, since by data reduction the same procedure is applied before the ramps' fitting)
- Change Saturation Parameters: This calls the PIA Voltages Level Setting menu, which allows the accepted dynamic range to be modified by typing minimal and maximal accepted values.
- Set RPID's -> [1,1]: By this correction all the raster point IDs will be set to [1,1]. This correction is designed for tracking observations of solar system objects which contain different raster positions for the different pointings of ISO on the same object while this is moving.
View
This menu bar calls a submenu for obtaining the following information:
- Header Info: displays the FITS header information of the corresponding measurement (including logs of the corrections PIA has performed to the data).
- Compact Status: displays information on instrument configuration present on the Compact Status file of the corresponding measurement.
- Auxiliary Files:
For details on the given information see the ISO Handbook - Volume V: PHT-The Imaging Photo-Polarimeter.
- IS Report: Instrument Station report recorded during the on-line monitoring of the displayed measurement (entries in PISR-FITS files).
- OLP Report: information recorded during the off-line pipeline processing of the displayed measurement (entries in the POLR-FITS files).
- EOHA: Edited Observation History Attributes corresponding to the measurement.
- EOHI: Edited Observation History Information corresponding to the measurement.
- Deglitching Statistics: Temporary logfile including results of the read-outs deglitching correction. This is accessible after the correction has been performed and as long as this ERD window is active for this measurement. It is valid for both deglitching algorithms, yielding slightly different ouptut.
Process Measurements
This menu bar calls a submenu in order to process the whole measurement to the next level. The submenu offers the following possibilities for processing ERD data to SRD:After a selection the processing immediately starts and the result will be displayed in a new SRD Window.
- Fit Ramps
- 1st order polynomial
A first order polynomial fit is applied to every ramp, taking into account only the valid read-outs, to obtain the signal from the ramp slope, in [V/s]- 2nd order polynomial
Same proceeding using a second order polynomial. The coefficient of the linear term is then taken as the signal. Note that this is not the standard reduction method, thus the necessary calibration in the further reduction cannot be performed with the standard PHT calibration files.- 3rd order polynomial
Same as the former, by fitting a 3rd order polynomial. Same warning also.- use subdivided ramps
By this method the user can define "pseudo"-ramps, which are produced by splitting the measured ramps into sub-ramps. A menu pops up offering two types of subdivision, either choosing directly the number of read-outs per sub-ramp or the number of sub-ramps per ramp. A first order polynomial is then fitted to the so defined sub-ramps.
Using this method a better time resolution can be achieved, by partly renouncing the band-pass filtering for high frequency noise given by the method to fit a complete ramp.- Ramps pattern (only by P and C chopped measurements and not P32)
- Proceed
Hereby the special data reduction procedure developed for chopped measurements is applied, as explained in the Processing Algorithms chapter #5.- Customize
Pixels Choice
This menu bar is active only for C100, C200 and PHT-S data, where several pixels are to be analyzed. It calls a submenu with the following options:
- Individual Choice: This calls the PIA Display Choice window. For each display window the user can specify the pixel number, whose signal will be plotted. After the selection the window will be refreshed with the plots for the new pixels chosen.
- Serial Increment: This selects the next subsequent pixel to each of those shown. When pressing this button, in each window containing pixel N the signal corresponding to pixel N+1 will be plotted.
N Plots
This button allows the number N of plot windows shown in the middle row of the ERD window to be selected. After a selection the window will immediately be refreshed, containing N plots. Please note that this number will also be used for further main level windows.HK
This button calls a submenu for accessing the Housekeeping Menu. The user has the choice of displaying the Housekeeping data associated only to this measurement or to the full TDT data (in the rule composed of several measurements), as contained in the corresponding GEHK FITS product.
The associated windows
The PIA Read-Out Selection menu window
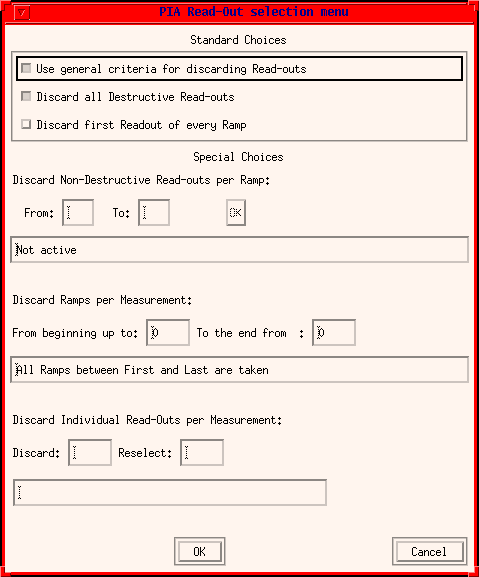
It is shown in FIGURE 2.

FIGURE 2: The PIA Read-Out Selection Window
This window offers several choices and input fields:
Standard Choices: The selection buttons are:For each entry the validity of the values chosen is checked.Use General Criteria: They are taken from the calibration CALG file PSELNDR. The criteria are not directly shown, but a trick to get knowledge about them is to switch this button off and on again: Then the values can be read under "Special Choice".Special Choices: Only active if General Criteria is disabled. Enter your choices with a <CR> and confirm them with the OK button on the righthand side. The new values are "displayed" in the box.
Note: de-activation of this button does not automatically mean a different selection, since the choice on which Read-outs have to be discarded has then to be made using the other elements of the menu.Discard All Destructive Read-Outs: (obvious) There is a general recommendation for discarding the destructive read_out, because it very often shows disturbance.
Discard first Readout of every Ramp: (obvious) The same recommendation as for the destructive read-out is given for the first Read-out of every ramp.
Discard Ramps per Measurement: This is for discarding whole ramps. Enter your selection with a <CR>. The new values are "displayed" in the box.
Discard Individual Read-Outs per Measurement: Enter the index of Read_Outs to be discarded (or reselected). Several indices can be entered step by step.
The PIA Ramps Deglitching Parameters Window
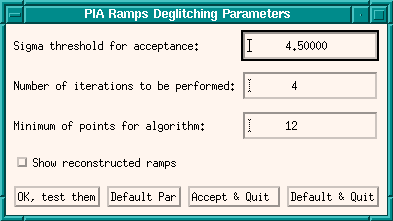
It is shown in FIGURE 3.

FIGURE 3: The PIA Ramps Delitching Parameters Window
This window exhibits the following fields and selection buttons:Sigma threshold: See deglitching algorithm description. in chapter 5.Number of Iterations: See deglitching algorithm description.
Minimum of points: This prevents trying to perform a statistical analysis with too low a number of points, implying a loss of validity for the algorithm. In case this limit is larger than the number of valid read-outs per ramp, the algorithm does not apply.
Show reconstructed ramps: If set, the reconstructed ramps are plotted.
OK, test them: This performs the read-out deglitching on that single pixel's signal which is plotted and shows the results in a PIA_Xplot Window. On this window the read-out values flagged as glitches are marked with a different color and symbol. At the same time a text window containing information on all corrected values is displayed.
Default Parameter: Reset the parameters to the default values.
Accept and Quit: Accepts the displayed parameters for the application onto the whole measurement (without performing the ramp deglitching). Then it quits the window.
Default and Quit: Reset to the default PIA parameters and quit the window.
The PIA Readout 2 threshold Deglitching Parameters Window
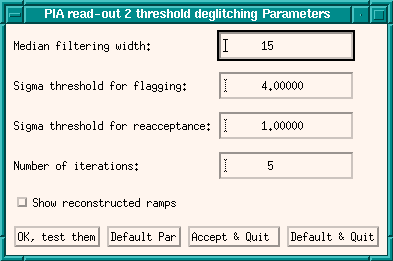
It is shown in FIGURE 4.

FIGURE 4: The PIA Ramps Delitching Parameters Window
This window exhibits the following fields and selection buttons:Median filtering width, Sigma threshold for flagging, Sigma threshold for reaccepance and Number of iterations: See the two threshold glitch recognition algorithm description in chapter 5.Show reconstructed ramps: If set, the reconstructed ramps are plotted.
OK, test them: This performs the read-out deglitching on that single pixel's signal which is plotted and shows the results in a PIA_Xplot Window. On this window the corrected read-out values are superimposed to the original ones. At the same time a text window containing information on all corrected values is displayed.
Default Parameter: Reset the parameters to the default values.
Accept and Quit: Accepts the displayed parameters for the application onto the whole measurement (without performing the ramp deglitching). Then it quits the window.
Default and Quit: Reset to the default PIA parameters and quit the window.
| Date | Author | Description |
|---|---|---|
| 13/05/1996 | Martin Haas (MPIA) / Carlos Gabriel (ESA) | First Version |
| 06/06/1997 | Carlos Gabriel (ESA-SAI) | Update (V6.3) |
| 10/10/1997 | Carlos Gabriel (ESA-SAI) | Update (V6.5) |
| 13/02/1998 | Carlos Gabriel (ESA-SAI) | Update (V7.0) |
| 19/08/1999 | Carlos Gabriel (ESA-SAI) | Update (V8.0) |