3.4) The Plot and Print Windows
3.4.1) The PIA Xplot Window
The PIA Xplot Window serves to control two dimensional plots. It is called from various places within PIA, e.g. when applying for "Zoom" in the ERD Window or for "Array/Plot Spectrum" in the SPD Window.This chapter describes the features of the PIA Xplot Window and its pull-down items.
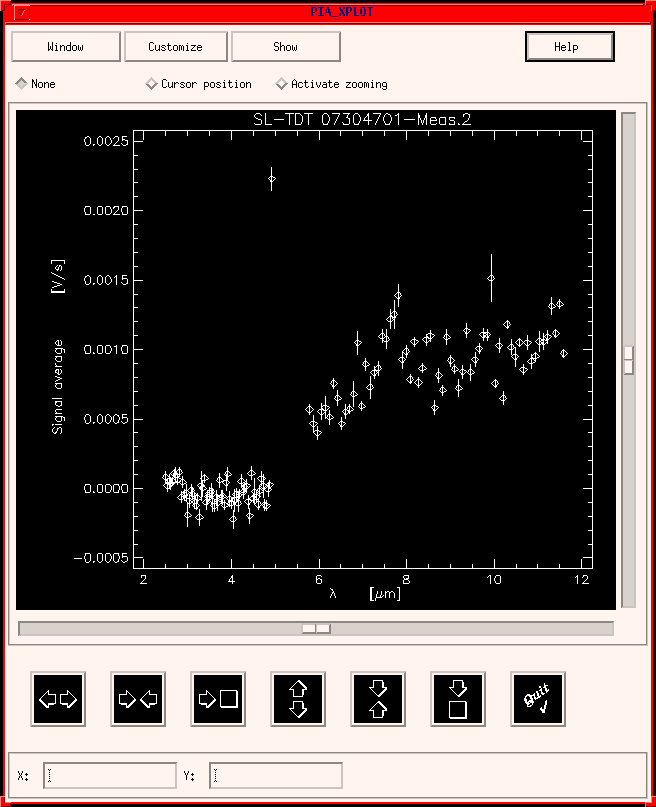
Figure 1 shows an Xplot example for PHT-S spectral data.
The items are:
Window
This pull-down menu in the upper row offers the following options:Activate This: The current window is activated for over-plotting in cases where there is more than one PIA Xplot window on the screen. Over-plotting actions of PIA are always performed in the last PIA Xplot window that was created, otherwise, since a new PIA_Xplot window always becomes active.Print: Sends the plot to the printer defined. In addition to the actual plot a legend and annotations are printed.
Print values: It gives a list of x, y, and error values plotted in a text window for the list to be saved or printed. If several plots are shown, it first offers a list of their legends to choose from.
Define Printer: This calls the PIA Printer Definition Window. Before printing a plot for the first time it is necessary to configure the printer.

FIGURE 1: The PIA Xplot Window
Customize
The customization defines the style of the plot. The chosen parameters are valid only for the current Xplot window. It is not possible to save a customization globally for all plots, i.e. the symbols used for the data points. For a new Xplot window the PIA default parameters will be used.The Customize pull-down menu offers the following options:
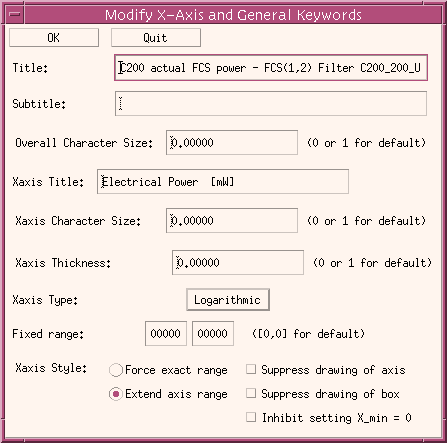
X-axis and General: This brings up the Modify X-Axis and General Keywords Window shown in Figure 2.Title: By default PIA set a title whenever calling PIA_Xplot. From the main windows the standard title for each plot contains the Detector, TDT number, measurement number and time of the data. The Title input field allows the title to be modified.Subtitle: Enter an additional subtitle.
Xaxis Title: Optionally modify the X-axis title.
Overall Character Size and Xaxis Character Size allow the character size used for the Title and X-axis title to be changed.
Xaxis Thickness Defines the thickness of the line used to represent the X-axis.
Xaxis Type: allows the scale between either Linear or Logarithmic to be switched.
Fixed Range: For forcing an x-range
X-axis Style: The selection buttons for this topic have the following effects:
Force exact range: The limits of the x-axis are forced to the exact start and end x-value of the plotted data.Extend axis range: Allow for extended x-axis so that the data points are not on the border.
Suppress drawing of axis: No Xaxis is plotted while active.
Suppress drawing of box: The line on top of the plot is not drawn.
Inhibit setting of X_min to zero: By idle default the zero point of the x-axis is included. Selection of this button allows optimum scaling according to the data values. Note: in most cases axis ranges are given in PIA from the calling program, thus it is not possible to modify them.

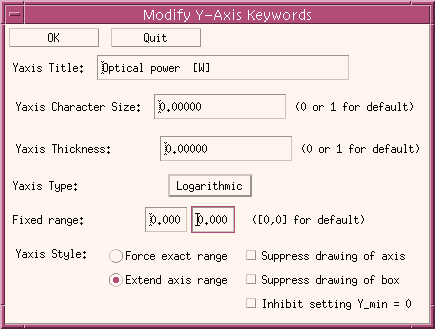
Y-axis: A submenu pops up with an entry for each Y-axis (#1, #2, ...) displayed, as produced by every overplot with its own Y-axis. Select one of the entries to change in Modify Y-Axis Keywords menu (Figure 3) the settings of the corresponding datasets. The menu for the Y-axis is very similar to the X-axis menu except that the general features are omitted. a

FIGURE 3: The Modify Y-Axis Keywords Window
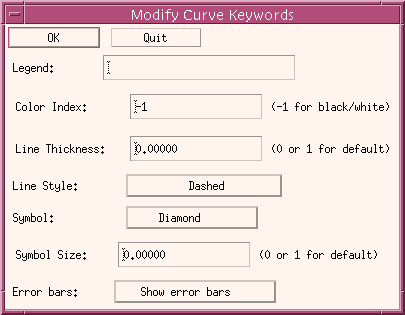
Curve: This allows the style of the plotted curves to be modified. It calls first a submenu in order to choose the desired curve (#1, #2, ...) in the case of several datasets plotted. Then it brings up the Modify Curve Keywords Window shown in Figure 4.

FIGURE 4: The Modify Curve Window
The fields and items of the Curve Window are:
OK: This button confirms the modifications and exits the window.Quit: This button exits the window without accepting any entered modifications.
Legend: This input field allows the legend of the curve to be modified. Defaults are e.g. data type and origin (pixel number).
Colour Index: This specifies the colour in which the current curve is printed/ plotted. The default is -1 for black on white printer output. Note: Changing this parameter to a wrong colour combination can make the curve invisible.
Line Thickness: Defines the thickness of lines.
Line Style: This pull-down menu offers various line styles for connecting the data points in the plot. The default is no line connection (none).
Symbol: This pull-down menu offers various symbols for the data points in the plot.
Symbol Size: Defines the size of data point symbols.
Show error bars: Error bars drawing can be for each PIA Xplot window individually inhibited (by default they are on, but they can be also generally suppressed)
Cursor: Active Y-axis: This sub-menu allows the selection of the Y-axis coordinate (#1, #2, ...) to be used for Display the Cursor Position in case there are several over-plots not synchronized.
Show
This pull-down menu offers the following options:Legend: This shows the legend of the current plot.
The legend may describe type of data and the symbols used.Annotation: This shows the annotation of the current plot.
The Annotation contains e.g. the information about the origin of the data, i.e. the detector, the TDT number and the number of the measurement within the TDT.
In addition it gives the status of the PHT instrument when the measurement was performed, i.e. the position of the change wheels and chopper operational mode.
None
This radio button just above the plot initializes (deactivates) the two radio buttons "Cursor Position" and "Activate Zooming".Displaying the Cursor Position
(Radio button: Cursor Position)The small radio button just above the plot allows the X and Y positions to be measured within the plot. Moving the mouse pointer into the plot, its current position is shown in the X and Y display fields at the very bottom of the Xplot Window. If there are several over-plots, the scale of the desired Y-axis can be selected via the option Cursor: Active Y-axis under the Customize pull-down menu.
Zooming
There are two alternatives:Note: These buttons do not work properly for plots with logarithmic scales, use the mouse zooming option for these plots.Zooming using the Mouse
(Radio button: Activate Zooming)The small radio button just above the plot allows a zooming area to be defined with the mouse. It is defined as follows:
Note: Dragging the mouse from the upper/right to the lower/left inverts the orientation of the axes of the plot. To return to the original plot press the buttons 3 and 6 from the list below.
- Move the mouse pointer to the lower left hand corner of the zoom range of interest.
- Press the left mouse button and keep it pressed.
- Move the mouse pointer to the upper righthand corner of the zoom range of interest. Thereby an outlined rectangle will be dragged.
- Release the left mouse button. This will display the zoom of the selected region.
Zooming using Push Buttons
This button stretches the X-axis by a fixed factor.
This button contracts the X-axis by a fixed factor.
This button brings the X-axis back to the original scaling factor.
This button stretches the Y-axis by a fixed factor.
This button contracts the Y-axis by a fixed factor.
This button brings the Y-axis back to the original scaling factor.
This button quits PIA Xplot (same as Quit under the menu "Window").
Special Case of PIA_Xplot: Selecting regions
PIA_Xplot is also used in a special mode within PIA: for selecting regions (eg. to be discarded). In this case, it works in IDL modal mode, thus no overplots are possible. It accepts as many selections as are marked for selection or deselection via the mouse.When called in this special mode all the normal capabilities (eg. expansion, customizing, printing, etc.) are available. In addition a region selection capability can be activated via two buttons localized in the second row (containing "cursor position" and "activate zooming"), labelled "Select area" and "Select on X-axis". Moving the mouse to the plot with the lefthand mouse button pressed, marks a portion of it in a red square, which is then fixed when the mouse button is released. A new portion of the plot can then be marked by repeating this procedure.
If "Select area" is chosen, the exact area given is then selected, as given by the X and Y limits. If the option "Select on X-axis" is active, everything corresponding to the X limits is then selected.
| Date | Author | Description |
|---|---|---|
| 04/07/1995 | Ingolf Heinrichsen (MPIK) | First Version |
| 25/04/1996 | Martin Haas (MPIA)/ Carlos Gabriel (ESA-SAI) | General Update |
| 07/03/1997 | Carlos Gabriel (ESA/VILSPA-SAI) | Update |
| 06/06/1997 | Carlos Gabriel (ESA/VILSPA-SAI) | Update (V6.3) |
| 11/07/1997 | Carlos Gabriel (ESA/VILSPA-SAI) | Update (V6.4) |
| 16/10/1997 | Carlos Gabriel (ESA/VILSPA-SAI) | Update (V6.5) |
| 25/08/1999 | Carlos Gabriel (ESA/VILSPA-SAI) | Update (V8.0) |