3.4.4) The Show Structures - Plot Curves Window
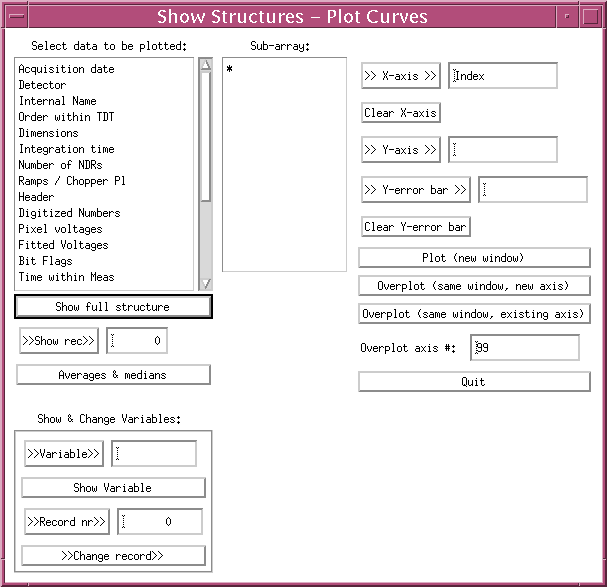
The Show Structures - Plot Curves Window as shown in Figure 1 allows the internal data structures of PIA to be investigated. It can be called from various point within PIA and is context sensitive, i.e. on startup the menu already contains the data relevant to the current stage of processing.

FIGURE 1: The Show Structures - Plot Curves Window
This window has the following buttons and boxes:
Select data to be plotted: This selection box offers the various structures to be plotted or printed - if not numeric.
Sub-array selection box: This is loaded with the structure of the data, i.e.:
- in the case of a one-dimensional array only the asterix (*) will appear,
- in the case of two-dimensional data arrays the index of the 2nd dimension is given as a running index in addition to the asterix. By clicking on the asterix the entire (1 or 2 dimensional) array is selected for displaying or plotting; selecting any of the indices will prepare the selected slice in the data array for plotting or display.
>> X axis >>, >> Y axis >> and >> Y-error bar>> buttons: The X or Y axis of the plot that shall contain the selected data has to be assigned by clicking on the button with the mouse. The selected item is then displayed in the field to the right of the button. This way it is possible to plot any two combinations of numerical data sets or slices against each other. At least the Y axis has to be assigned. If the X axis is not assigned to any variable then the data will be displayed versus a running index, in the case of two dimensional arrays ARR(n,m) first versus n and then versus m. If Y-error bar is filled with a variable the corresponding amounts will be displayed as error bars.
Plot (new window):
Overplot (same window, new axis):
Overplot (same window, existing axis):
A PIA_Xplot Window (s.3.4.1) is called.
Note: The above procedure only works for numerical data fields, for a string field a text display window automatically appears, instead of the PIA_Xplot window, allowing the content of the data field to be read.
Special buttons: On the left side of the menu, below the Select data ... several buttons allow for viewing a structure per record and for changing variables within the structures:
- Show full structure: This button allows for a complete list of the full structure (be careful when using it, long structures can be very long), record by record on a text window.
- Show record: By filling with a record number, all the variables corresponding to this structure record will be shown on a text window.
- Averages & medians: will be calculated from all the values corresponding to the chosen variable under Select data ... The results are shown on a text window.
- Show and Change variables: The use of the buttons under this label allow values to be changed manually within the structures, locally. Only in cases where programmes make use of this capability, are the corresponding buffers updated by PIA. So far, this capability has only been used for special calibration procedures, not accessible in the export version of PIA.
| Date | Authors | Description |
|---|---|---|
| 04/07/1995 | Ingolf Heinrichsen(MPIK) | First Version |
| 23/05/1996 | Martin Haas (MPIA)/Carlos Gabriel(ESA) | General Update |
| 10/06/1997 | Carlos Gabriel (ESA/VILSPA-SAI) | Update (V6.3) |