During the course of the ISO mission, hundreds of calibration observations were obtained. From this database, both the various calibration factors and their uncertainties were determined.
The SWS error budget is presented in 4 main sections. The first section will describe in some detail the sources of uncertainty present in SWS. The second section looks specifically to the uncertainties impacting the photometric calibration. The third section describes the reproducibility of SWS observations. And finally, the last section presents the error budget for a general observation.
In general, the detector noise is comprised of dark noise, readout noise, and glitches. Detector noise is present in all observations as an additive noise value. Therefore the brighter the source the less important the detector noise. Detector noise will effect the determination of a low contrast feature. As far as the photometric calibration is concerned, detector noise is an important source of uncertainty only if the calibration sources have a low signal in the band. This is true only for bands 3E and 4, where there is a lack of bright calibrators.
The percent uncertainty introduced by dark current noise on the
photometric calibration can be estimated by applying typical dark
current noise levels to a Monte Carlo simulation of the calibration
procedure. The dark current estimates assume dark current uncertainties
of 5 ![]() V/s for band 3E and 10
V/s for band 3E and 10 ![]() V/s for band 4 (Heras et al. 2000,
[15]).
A random component of 5
V/s for band 4 (Heras et al. 2000,
[15]).
A random component of 5 ![]() V/s and 10
V/s and 10 ![]() V/s is added to the
brightness (in
V/s is added to the
brightness (in ![]() V/s) for all the the objects used for photometric
calibration. For the bright objects this random component does
not change the signal much, for the dimmer objects this procedure
can cause significant variations in the signal. The percent uncertainty
introduced through detector noise in these bands is estimated as
5% and 2%, respectively.
V/s) for all the the objects used for photometric
calibration. For the bright objects this random component does
not change the signal much, for the dimmer objects this procedure
can cause significant variations in the signal. The percent uncertainty
introduced through detector noise in these bands is estimated as
5% and 2%, respectively.
The calibration for band 3E relies on ![]() Dra as one of its main
calibrators. However, the signal for
Dra as one of its main
calibrators. However, the signal for ![]() Dra is quite low at
28
Dra is quite low at
28 ![]() m and the dark current subtraction introduces a large
uncertainty due to detector noise and uncorrected glitches. It was
decided to use the
m and the dark current subtraction introduces a large
uncertainty due to detector noise and uncorrected glitches. It was
decided to use the ![]() Dra observations for 3E for stability
of the photometric calibration.
Dra observations for 3E for stability
of the photometric calibration.
Radiation hits (glitches) are events which add/subtract a transient signal to the detector. In general they do not impact the responsivity directly (Wieprecht, Wiezorrek & Haser 2000, [43]). However, glitches can have an impact on the overall photometric calibration through three routes. First they can directly affect the signal of the Astronomical Calibration Source (ACS) during the observation. Second, radiation hits can occur during the internal calibrator scan and or during the dark current measurement. Third, for some detector blocks (2 and 4) there are significant transients (memory effects) caused by the glitch which normally appear as a decaying signal.
In general, most glitches are effectively identified, removed or repaired during standard processing. Each data sample where a glitch was detected is flagged. For the photometric calibration on standard sources, these samples are not used. Furthermore, the SWS design and observation strategies minimized the effects of glitches through the high degree of redundancy (12 detectors each with 2 scans covering the same wavelength range).
This redundancy is used to measure the gain based on the internal
calibrator scans. Since the gain measured by the internal calibrator
is applied to all data within the detector block, it is vital that
glitches not identified by the pipeline get filtered out of the data.
This is done for the
![]() samples in an internal calibrator
scan by iteratively filtering significant outlying points (more
than 3
samples in an internal calibrator
scan by iteratively filtering significant outlying points (more
than 3 ![]() in one iteration).
in one iteration).
Glitches have an impact on the photometric calibration through the
residual tails which are present in the observations of the ACSs.
band 4 detectors have the strongest glitch tails. The level of
these tails taken collectively over all band 4 detectors is estimated
at 5 ![]() V/s. For the calibration of band 4, this number is
subtracted from the measured signal. This correction only has
impact on the low signal sources in band 4, less than 100 Jy, but
is applied to every source. It is estimated that the uncertainty
introduced by glitches to the calibration of band 4 is on the order
of 5%.
V/s. For the calibration of band 4, this number is
subtracted from the measured signal. This correction only has
impact on the low signal sources in band 4, less than 100 Jy, but
is applied to every source. It is estimated that the uncertainty
introduced by glitches to the calibration of band 4 is on the order
of 5%.
Analysis of the uncertainty introduced by memory effects is complicated. However, one gets a hint from the so-called 'band-border' plots. These plots are made by comparing the flux level at the border of one band with the flux level in the other overlapping band. Note that the band borders may not be used for calibration since the band border itself is defined as a low responsivity wavelength regime of the detectors.
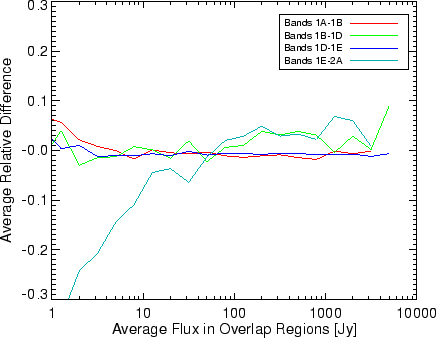
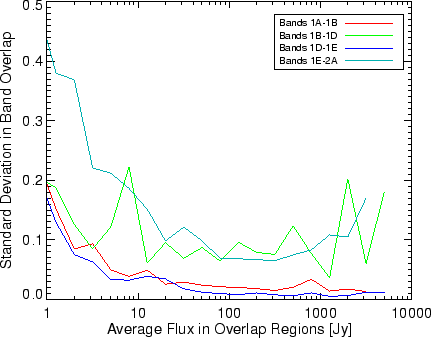
Figure 5.33 shows the band border ratios between
1A-1B, 1B-1D, 1D-1E and 1E-2A. These band-border values have
been binned and averaged at flux levels between 0.1 and 10000 Jy.
The 1E-2A ratios appear to have a systematic error relative to 1E.
Note that this ratio does not suffer from an aperture change. The
variation (for signals greater than 100 Jy) increases by 10% and
then decreases by 10%. The shape of the trend is probably due to
uncorrected memory effects. Based on this figure, the uncertainty
is estimated at 5% (1![]() ). An uncertainty of 5% is also consistent
with the standard deviation of the band border ratio between 2A-2B
shown in Figure 5.37. The uncertainty for memory
effects definitely increases for signals larger than 1000 Jy. Based
on this figure the uncertainty at high flux levels is between 10%
and 20% due to memory effects.
). An uncertainty of 5% is also consistent
with the standard deviation of the band border ratio between 2A-2B
shown in Figure 5.37. The uncertainty for memory
effects definitely increases for signals larger than 1000 Jy. Based
on this figure the uncertainty at high flux levels is between 10%
and 20% due to memory effects.
|
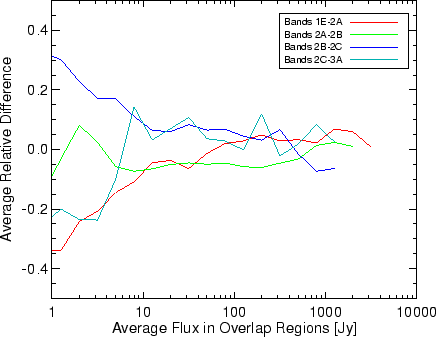
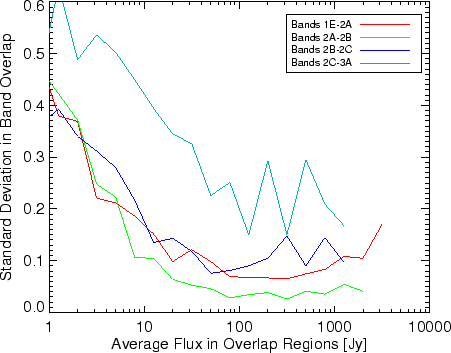
In Figure 5.34, the band border ratios for band 2 are shown, including band borders 1E-2A and 2C-3A. Note that the overlap between 2A and 2B is the only band 2 border ratio which occurs within the same aperture for the same detector material and should only have memory effects influencing the uncertainty of the ratio. The ratio 2B to 2C suffers from both memory effects and aperture change (i.e. pointing, see 5.9.1.6). This ratio shows a decline which steepens after a few hundred Jy. The 2C to 3A ratio seems noisy but constantly high by 10%, this could be either a problem with absolute calibration or the RSRFs for these two bands.
Also note that band border calculations below 10 Jy, have influences from dark current subtraction as well as any other gain problems and are less useful to check the calibration consistency.
All the stellar model SEDs used in the absolute photometric calibration claim accuracies between 3% and 6% depending on wavelength, except for NML Cyg which is not a good quality calibrator. NML Cyg is likely a variable source so the accuracy of this source as a calibrator is 30%. However, NML Cyg is very bright and can still provide important constraints on the linearity of the detectors.
Bands 1 and 2 are calibrated exclusively against stellar sources. Bands 3A-3D rely mainly on stellar sources with some input of the source NML Cyg.
The uncertainty introduced through the SEDs is reduced only by
observing different sources. For example, it is assumed that all
stellar sources have an uncertainty of 3%. Assuming the errors in
the calibration sources are uncorrelated, a 3% uncertainty is
reduced by the observation of 13 different sources. Since every
band observed at least 9 different objects, all bands get some
benefit. Even bands which partially use NML Cyg (![]() 30% uncertainty)
only show an influence of 3% from the models themselves.
30% uncertainty)
only show an influence of 3% from the models themselves.
The assumption of uncorrelated errors between models or between composites does not necessarily hold. Fortunately for the SWS photometric calibration at the key wavelength, the uncertainty of the models is not the limiting factor in the photometric accuracy.
|
|
In this section, we present two separate analyses demonstrating the influence of pointing errors on the absolute photometry of SWS. In Figure 5.35 an analysis of the beam profiles stored in the Cal-G 35 is shown.
For this analysis, the pointing in dispersion and cross dispersion is
assumed to have a random error about the zero (perfect pointing) with a
Gaussian distribution of width ![]() . The
. The ![]() s are stepped
through 40 different values ranging from 0.1" to 3". A random pair of
s are stepped
through 40 different values ranging from 0.1" to 3". A random pair of
![]() and
and ![]() coordinates are generated from a Gaussian distribution of
width
coordinates are generated from a Gaussian distribution of
width ![]() . The value of the beam profile for this random pair is
recorded. For each
. The value of the beam profile for this random pair is
recorded. For each ![]() , 10,000 random pairs are drawn and the
standard deviation is determined. This standard deviation is labelled as
the resulting relative uncertainty in photometry due to pointing and it
is shown in Figure 5.35. This figure can be used to
estimate the impact of pointing errors on the flux of point sources in
each band. The figure can also be used to determine, from the point of
view of SWS, the satellite pointing accuracy.
, 10,000 random pairs are drawn and the
standard deviation is determined. This standard deviation is labelled as
the resulting relative uncertainty in photometry due to pointing and it
is shown in Figure 5.35. This figure can be used to
estimate the impact of pointing errors on the flux of point sources in
each band. The figure can also be used to determine, from the point of
view of SWS, the satellite pointing accuracy.
The star ![]() Dra was observed many times by SWS. The peak to peak
variation of the signal at the key wavelength for these observations
was 30% in band 3A. According to Figure 5.35, a
1.5" pointing uncertainty would produce such a variation in photometry
for band 3A. Assuming that all observations are effected by a 1.5"
pointing uncertainty, results in the photometric uncertainties listed
in Tables 5.5, 5.6 and
5.7 due to pointing.
Dra was observed many times by SWS. The peak to peak
variation of the signal at the key wavelength for these observations
was 30% in band 3A. According to Figure 5.35, a
1.5" pointing uncertainty would produce such a variation in photometry
for band 3A. Assuming that all observations are effected by a 1.5"
pointing uncertainty, results in the photometric uncertainties listed
in Tables 5.5, 5.6 and
5.7 due to pointing.
It should be pointed out that the variation in the signal from
![]() Dra was not a random variation. As can be seen in
Figure 8.8, the variation appears to by cyclic
with a period of one year. Much effort has been put into identifying
the cause of the signal modulation of
Dra was not a random variation. As can be seen in
Figure 8.8, the variation appears to by cyclic
with a period of one year. Much effort has been put into identifying
the cause of the signal modulation of ![]() Dra. This effort resulted
in significant improvements of the accuracy of the satellite pointing.
However, there remains
a pointing error on the order 1.5" affecting all SWS observations.
Dra. This effort resulted
in significant improvements of the accuracy of the satellite pointing.
However, there remains
a pointing error on the order 1.5" affecting all SWS observations.
In band 1, the band ratios of 1A-1B and 1D-1E are from bands within the same apertures. Satellite mis-pointings should not have a significant impact on these ratios. Thus the baseline relative uncertainties at fluxes above 10 Jy is worth a closer inspection. From Figure 5.36 the uncertainty is on the order of 1% for the two ratios. This level of uncertainty can be a combination of internal gain changes (which are note probed for band 1) and/or satellite jitter of 0.7".
The band ratio, 1E-2A also occurs within the same aperture. In this case the memory effects play a significant role in band 2.
|
Since the photometric calibration is the last calibration step (on the responsivity of the detectors) in the pipeline, this calibration will have been affected by all pipeline errors, systematic and random. The dispersion about the average conversion factor in the photometric calibration is then taken as the final photometric uncertainty in the specified band. These are the values already indicated in Table 5.3
The uncertainties in the SWS processing stream appear as systematic errors (uncertainties in calibrations) and random errors. The main wavelength dependent, systematic uncertainties have been discussed in the RSRF section, 5.4.6. The RSRF uncertainties will not be included in the discussions below.
Table 5.5 is the error budget (listed as
1![]() uncertainties) for the photometric calibration for the SWS
grating at the key wavelengths. This table includes the uncertainties
of the SEDs used for calibration as well as the impact of low signal
calibration
sources on the uncertainty of the photometric calibration.
uncertainties) for the photometric calibration for the SWS
grating at the key wavelengths. This table includes the uncertainties
of the SEDs used for calibration as well as the impact of low signal
calibration
sources on the uncertainty of the photometric calibration.
Table 5.6 shows the expected reproducibility of SWS grating observations based on the known uncertainties in the SWS calibration. The NGC 6543 line fluxes largely confirm the uncertainties in the processing pipeline. For this comparison, the uncertainties introduced by fringes are explicitly expressed since fringing will have a significant impact on the line fluxes.
The uncertainties listed in Table 5.6 are the root sum squared (rss) values of the different uncertainty components. This is likely to produce an over-estimate of the uncertainty for a number of reasons. First, since reproducibility is a question of repeating an observation, instrumental effects like transients are likely to be highly reproducible as well. Pointing is also a component in the uncertainty, but for extended sources the pointing uncertainty will not have the impact that it has for point sources.
As discussed in Feuchtgruber 1998b, [7], NGC6543 is not
ideal for determining the reproducibility. The 32 observations were
designed to monitor the wavelength calibration and do not cover every
band. Furthermore, NGC6543 is extended and has quite a bit of
structure in the line emission. Most of the line fluxes show a
biannual variability which is consistent with the changing roll angle
of the observations. For the lines showing the modulation, fitting out
the modulation reduces the uncertainty by 1-3 percentage points.
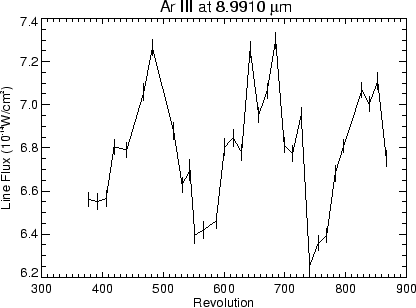
Figure 5.38 shows the Ar III line flux for 32
observations after revolution 377. The Ar III line occurs at 9 ![]() m
within band 2C. The biannual modulation is evident in the figure,
however, the standard deviation of the line fluxes is only 4%, when
the modulation is taken into account the standard deviation drops to
2%. The uncertainties listed in Table 5.6 have
not been corrected for this modulation.
m
within band 2C. The biannual modulation is evident in the figure,
however, the standard deviation of the line fluxes is only 4%, when
the modulation is taken into account the standard deviation drops to
2%. The uncertainties listed in Table 5.6 have
not been corrected for this modulation.
|
There are four main sources of random uncertainties in SWS data:
In Table 5.7, we indicate the average dark current noise along with the photometric uncertainties. The dark noise listed is a typical value on 2 sec resets per detector as measured in orbit (Heras et al. 2000, [15]).
The last two columns of Table 5.5 are the
root sum squared of the listed uncertainties and the observed
standard deviation of the calibration observations. These two
columns agree very well, indicating that uncertainties are relatively
well understood. The difference between the expected band 3E and
the measured value is significant and points to something not yet
taken into account.