

Next: 5.7 The Strong Source
Up: 5. Calibration and Performance
Previous: 5.5 In-orbit Sensitivity of
Subsections
5.6 Photometric Accuracy
The accuracy of the photometric calibration is determined by a number of
factors:
- The measurements of Uranus that were used for the calibration
result in a high S/N spectrum. However for sources brighter than
Uranus that are
observed long enough, the S/N of the resulting spectrum is
limited by the S/N of the Uranus spectrum. The uncertainty in
the RSRF is written in the calibration file containing it (see
Section 7.3.2.4).
- Transients or memory effects may have an influence on the photometric
accuracy of the data. The extent of their influence is not
clear at this time.
- Ramp (non-)linearity will also influence the accuracy. It is
believed that Derive-SPD is handling this reasonably well,
except for really bright sources for which a correction is
needed (see Section 5.7). However, comparison of
planet and asteroids spectra with their models have suggested that
some detectors (LW1, LW2 and LW3) could have a non-linearity
behaviour resulting in a few % photometric errors in their
ranges. This effect is still under investigation.
- The dark background removal will, especially for faint sources, be
an important factor in the photometric accuracy. The
effect depends on the source strength and the spectral shape
(see Section 6.4). For very faint
sources the drift correction applied in AAL may result in negative
fluxes (see Section 4.4.1.3).
- Glitches also influence the photometric accuracy, since they have an
effect on the responsivity of the detectors.
All these factors together lead to a photometric repeatability for LWS
grating mode spectra of 10% between scans on the same detector
(this is mainly due to the effect of responsivity changes), and 30%
between
adjacent detectors (mainly due to dark background removal problems for
faint
point sources and to the source extent for extended sources).
5.6.1 Calibration sources used for photometric purposes
To check the photometric calibration and the relative response calibration
several sources were used during PV phase and during the routine
calibration observations. Table 5.6 gives the sources
used for different calibration purposes.
Table 5.6:
Sources used for
checking the photometric calibration and the relative response
calibration of the LWS grating and Fabry-Pérot subsystems.
The primary source for the grating flux calibration is Uranus,
the other sources have been observed regularly for monitoring
purposes. FG: Fixed Grating; FP: Fabry-Pérot.
| Source |
Type |
Observation |
|
Absolute Flux Calibration and Relative Response Function |
|
Uranus |
planet |
End to end grating scans (extended range) |
|
Absolute Flux Calibration: checking and monitoring |
| Uranus |
planet |
FG position On and Off source and full scan |
| Neptune |
planet |
FG position On and Off source and full scan |
| Ceres |
asteroid |
FG position On and Off source |
| Pallas |
asteroid |
FG position On and Off source |
| Vesta |
asteroid |
FG position On and Off source |
| Arcturus |
star |
FG position On and Off source and full scan |
| Aldebaran |
star |
FG position On and Off source and full scan |
 Dra Dra |
star |
FG position On and Off source |
| S106 |
HII region |
FG and full scan |
G298.288 0.331 0.331 |
HII region |
FG and full scan |
| NGC 6543 |
PN |
full grating scan |
| NGC 7027 |
PN |
full grating scan |
Fabry-Pérot `throughput correction'
(transmission  resolution element) resolution element) |
|
Mars |
planet |
Fabry-Pérot scans with fixed grating (mixed mode) |
5.6.2 LWS photometric stability checked with observations of Mars
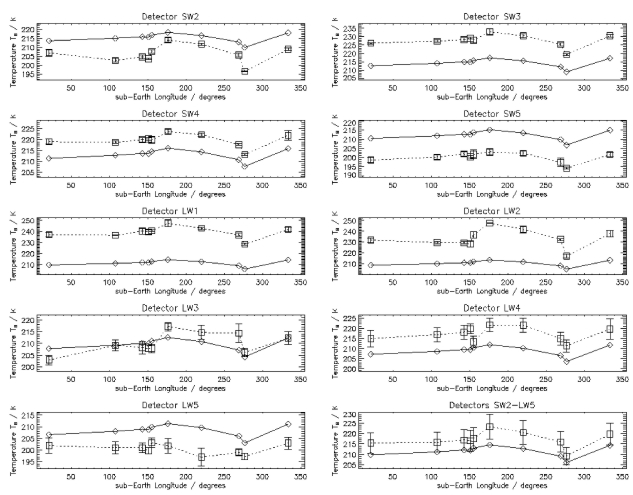
Sidher et al. 2000, [39] used ten LWS full grating scan
observations (L01) of Mars to demonstrate that the observed  3%
rotational modulation of the FIR disk-averaged brightness temperature
can be detected with the LWS and that it
compares very favourably with the predictions of the
thermophysical model developed by Rudy et al. 1987, [37].
Figure 5.5
shows the observed and predicted modulation in each detector (except SW1
which is excluded
because it suffers from memory effects) as
well as a detector-averaged modulation. All these observations were
processed as 1/4 s integration ramps by discarding the second-half
of each
1/2 s ramp (see Section 5.8)
in order to eliminate the non-linear behaviour seen in some
LWS detectors for high fluxes.
The absolute photometric accuracy evidenced by this figure is better than
10% for most detectors (observations and model differ by up to
 15%
in LW1 probably due to some residual non-linear effects). But what this
figure shows primarily is that the LWS photometry is very stable,
to a few % level,
and that LWS can be used to detect variations as low as 3%.
Mars is a very bright source (25000 Jy at 100
  m) so the uncertainties
due to dark current or background subtraction are minimal. For faint
sources, such a high level of stability might be hidden due to dark
current uncertainties.
Figure 5.5:
The
modulation of the brightness temperature as a function of
sub-Earth longitude for detectors SW2 to LW5. The last
panel shows the brightness temperature averaged over all
nine detectors. The observations are
shown as squares and the model as diamonds.
The absolute photometric accuracy evidenced by this figure
is better than 10% for most detectors but the LWS
photometric stability is much better since it allows to
detect the predicted variations of  3%.
3%.
|
|
5.6.3 Comparison with IRAS fluxes
An extensive study comparing LWS and IRAS fluxes over a wide range
of flux values has been performed by
Chan et al. 2001, [6].
A summary of the study is given here highlighting the results concerning
the photometric comparison between IRAS and LWS.
The objects used for the comparison were selected among all LWS observations
on the basis of the following criteria:
- Objects included in the IRAS Point Source Catalogue (PSC)
and observed with LWS with AOT L01
- Non far-infrared variables
- Non-fringed LWS data
- IRAS flux density qualities
 2 in the 60
 m
and 100
 m bands
-
 (100
(100 m)
m)  1000 Jy - to avoid detector
non-linearity
-
 where
where
 is the flux ratio of cirrus and source
- IRAS `Point source correlation coefficents'
A (100%) or B (99%)
in the 60
 m and 100
 m bands
- Only source within 2
 search radius
- IRAS CIRR3
 254 MJy/sr, with no strong cirrus
background at 100
 m on the
IRAS Sky Atlas Map or on the LWS Parallel Map in the
LW1 detector
The sample selected following the above criteria
contains around 120 objects.
To check if the comparison of the IRAS and LWS fluxes is source-dependent
(via the spectral shape for example), the sample was divided into six
groups of different object types: group 1: dust stars; group 2:
planetary nebulae; group 3: galaxies; group 4: interstellar medium;
group 5: young stellar objects; and group 6: Vega-like stars.
The LWS spectra were first corrected for the presence of near-infrared
leak features
when needed (see Section 6.7 for the description of the
feature and the correction).
A `cirrus correction' was applied to take out the contribution of the
background flux due to the interstellar medium emission at the source
position.
Two different corrections were applied: either the IRAS flux was corrected
using the CIRR2 value given in the IRAS PSC,
or the LWS flux was corrected based on the IRAS CIRR3 value.
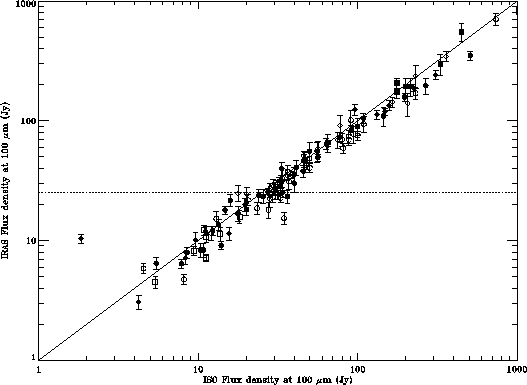
Figure 5.6:
Comparison of IRAS and ISO LWS fluxes at 100  m
for a wide range of fluxes.
The different symbols indicate the different groups (object types)
listed in the text. No trend is seen with object type.
|
|
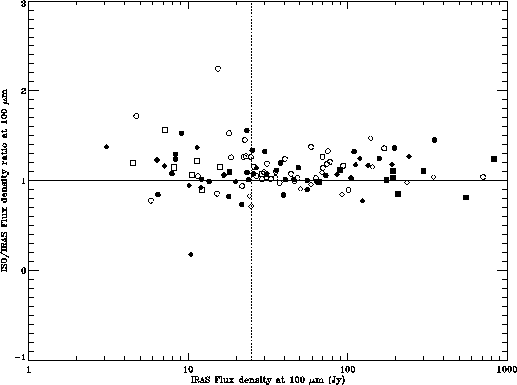
Figure 5.7:
Ratio of the IRAS flux to ISO LWS flux at 100  m
for various
source types.
|
|
Figure 5.6 shows the distribution of IRAS
fluxes versus LWS fluxes at 100 m.
Each type group
is plotted with a different symbol, and one can check that there is no
noticeable
difference between the groups.
Figure 5.7 shows the same results, but this time the
ratios of LWS to IRAS flux densities are presented.
First one should note that there is a reasonably good agreement between
IRAS and ISO flux values (within 30%), in spite of the relatively large
uncertainties associated with the needed correction factors.
However, the plots do evidence systematic effects that deserves
more attention: in average ISO fluxes are 12.5% higher than IRAS
fluxes and the differences seem to increase with increasing flux.
Therefore, to further investigate this behaviour, the flux comparison has
been extended to the 60 m band and has been broadened by including
other sources: on one hand, 23 sources used
for cross-calibration between
SWS and LWS in the context of the ISO cross-calibration
(García-Lario 2001, [18])
and on the other hand, 155 galaxies observed with LWS,
the fluxes of which were measured and compared to IRAS fluxes by
Brauher & Lord 2001, [3].
At 60
 m, the LWS observations do not cover the whole IRAS band.
In the cross-calibration sample only sources that were observed also with
SWS were used in order to reconstruct the ISO flux at 60
  m; for the
extragalactic sample a small correction was applied in order to
compensate for the fraction of the spectral energy distribution not covered
by LWS. Complete details are given in García-Lario 2001, [18]
and Brauher & Lord 2001, [3].
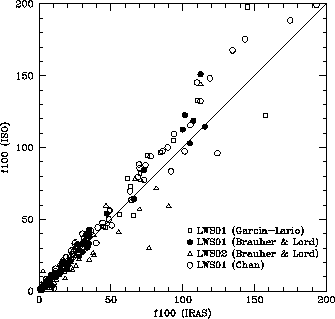
Figure 5.8:
Comparison of IRAS and ISO LWS fluxes in Jy
at 100 m for
the three samples described in the text.
The first plot is a close-up of the second one at low fluxes.
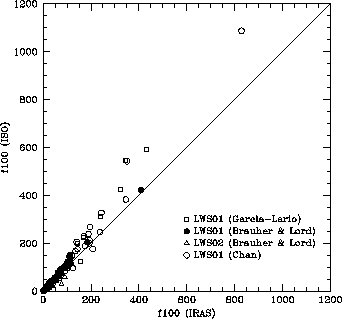 |
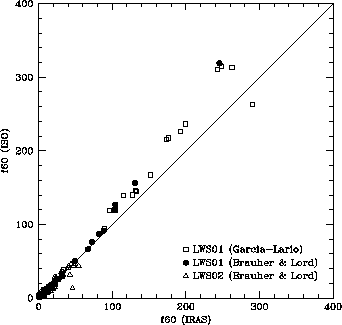
Figure 5.9:
Comparison of IRAS and ISO LWS fluxes in Jy at 60 m.
The first plot is a close-up of the second one at low fluxes.
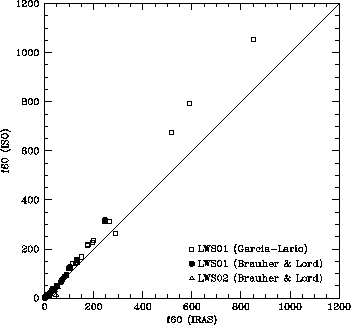 |
Figure 5.8 and 5.9 show the
ISO versus IRAS fluxes for the three samples.
It is clear on these plots that there is a systematic difference
between ISO and IRAS fluxes for bright sources.
For faint sources, IRAS and ISO fluxes agree within
a few % in average, with a high dispersion due
to uncertainties in the dark current.
However for brighter sources, ISO fluxes are systematically higher
than IRAS fluxes, and the difference increases with flux level, from about
15% difference around 100 Jy, to a level of
about 20% for sources up to 400 Jy, and 30-50% for sources brighter than
400 Jy.
The reason for this behaviour is not understood.
It is not due to inaccurate dark current subtraction since this would affect
the faintest sources unlike what we observe here. On the other hand it
does not seem to be due to cirrus background contamination, since no trend
is observed with the IRAS CIRR2 parameter value.
A possible cause could be some non-linear effects in the IR detectors.
However, the problem could be associated with IRAS and not with ISO.
Indeed, Figure IV.A.4.2 of the IRAS Explanatory Supplement,
([20]) does evidence detector non-linearity behaviour
and Section VI.B.4.d quotes errors of respectively 30% and 70%
at 60 and 100 m for sources above 100 Jy.
Further investigation is needed to decide if the systematic difference is
imputable to IRAS or LWS calibration inaccuracies.
5.6.4 Checking the Fabry-Pérot photometric accuracy
For the Fabry-Pérot mode, the photometric accuracy was determined by
comparing the integrated line fluxes observed with the FP with the fluxes
observed with the grating or line fluxes published in the literature. The
sources and lines are given in Table 5.7. It was found that
for strong lines accuracy is typically better than 30%. For faint lines
however, the FP fluxes can be off by almost a factor two. This is mainly due
to the removal of the dark current which is known to be problematic
for low signal levels (see also Section 4.4.1.3 and
5.4).
Table 5.7:
Sources and lines used
for the determination of the photometric accuracy of
the Fabry-Pérot data.
|
Source |
Type |
Lines |
|
NGC 6543 |
PN |
57.3, 88.4  m m |
| NGC 7027 |
PN |
51.8, 63.2, 145.5, 157.7  m m |
| NGC 6357I |
HII region |
51.8, 57.3, 63.2, 88.4, 145.5, 157.7  m m |
| M 82 |
Galaxy |
63.2, 88.4, 121.9, 157.7  m m |


Next: 5.7 The Strong Source
Up: 5. Calibration and Performance
Previous: 5.5 In-orbit Sensitivity of
ISO Handbook Volume III (LWS), Version 2.1, SAI/1999-057/Dc
