|
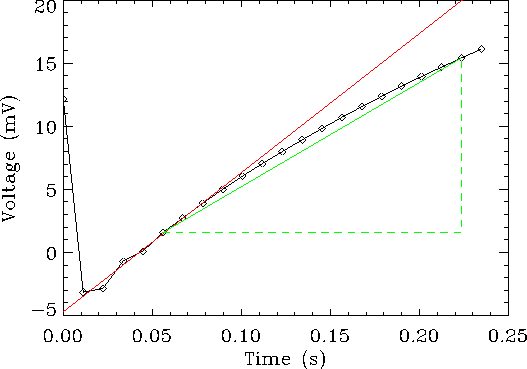
The responses of detectors LW1-LW4 are non-linear when they are exposed to strong sources. This non-linearity means that the photocurrent is lower than expected for the flux incident on the detectors. This occurs because the voltage produced by the radiation on the detectors de-biases them. This de-biasing lowers the responsivity hence an increase in the input signal does not produce the same increase in the output voltage, the value is lower and so the ramps are curved.

|
Figure 5.10
shows a curved ramp for a typical strong source. The gradient of the
green line shows the value of
![]() (see Section 4.3.6) for the
ramp (the dashed lines
show the change in voltage and time). The red line indicates the
initial gradient of the ramp where the detector does not suffer from
de-biasing. Thus, it can be seen
that due to de-biasing the photocurrent obtained from
the
(see Section 4.3.6) for the
ramp (the dashed lines
show the change in voltage and time). The red line indicates the
initial gradient of the ramp where the detector does not suffer from
de-biasing. Thus, it can be seen
that due to de-biasing the photocurrent obtained from
the
![]() method
underestimates the true source flux of strong sources.
This becomes worse with stronger sources as the ramp curves more and could
eventually flatten off.
For any detector the instrument transmission varies across the
bandpass filter. At the edges of the detector filters
there is a low response to any signal and the effects of non-linearity are
correspondingly small. Where the instrument transmission is higher
the signal
suffers from more non-linearity as the flux on the detector is higher.
This difference across the instrument transmission means that an individual
detector spectrum is more non-linear near the centre of the
wavelength range, where generally the transmission is high, than it is at the
short and long wavelength cut-offs. This
produces strange shaped (saggy) sub-spectra
(see example in Figure 6.11).
method
underestimates the true source flux of strong sources.
This becomes worse with stronger sources as the ramp curves more and could
eventually flatten off.
For any detector the instrument transmission varies across the
bandpass filter. At the edges of the detector filters
there is a low response to any signal and the effects of non-linearity are
correspondingly small. Where the instrument transmission is higher
the signal
suffers from more non-linearity as the flux on the detector is higher.
This difference across the instrument transmission means that an individual
detector spectrum is more non-linear near the centre of the
wavelength range, where generally the transmission is high, than it is at the
short and long wavelength cut-offs. This
produces strange shaped (saggy) sub-spectra
(see example in Figure 6.11).
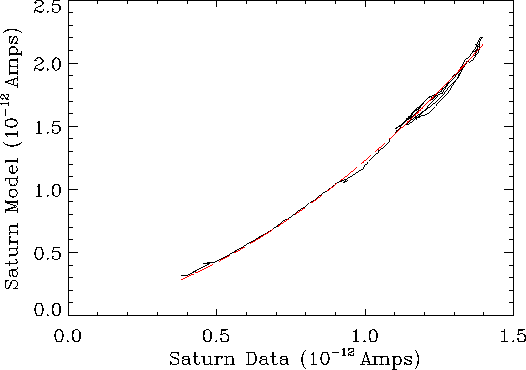
This non-linearity can be determined using the strong source Saturn, which is well modelled and is well calibrated in the short wavelength detectors (Davis et al. 1996, [13]). The flux model and the instrument transmission (RSRF) are used to find the photocurrents which we would expect for a linear system. These are then compared with the photocurrents found from the LWS observations of Saturn.
This comparison is shown in Figure 5.11 where the
model versus LWS photocurrents (![]() and
and ![]() ) are
plotted as a function of wavelength. There is
clearly a relationship between the two and we fit the second order
polynomial (shown by the dashed line in
Figure 5.11):
) are
plotted as a function of wavelength. There is
clearly a relationship between the two and we fit the second order
polynomial (shown by the dashed line in
Figure 5.11):
where ![]() and
and ![]() are the first and second order
coefficients. This is done for all of the detectors affected by
non-linearity
(LW1-LW4). The coefficients are then applied to any source photocurrents
(
are the first and second order
coefficients. This is done for all of the detectors affected by
non-linearity
(LW1-LW4). The coefficients are then applied to any source photocurrents
(
![]() ) to produce the photocurrents corrected for the
non-linearity (
) to produce the photocurrents corrected for the
non-linearity (
![]() ) using
) using
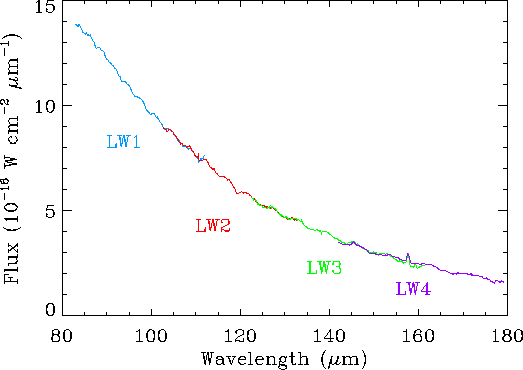
Figure 5.12 shows the result of this correction for the HII region W28A2 (the uncorrected spectrum is shown in Figure 6.11). To remove the scaling of individual sub-spectra that was introduced by the corrections, the sub-spectra were also scaled together using ISAP to produce a relative calibration.

|

|
This shows that the sub-spectra now have similar shapes. From the figure it can be seen that the `saggyness' has been removed from the sub-spectra and they line up smoothly. Also fringing, which is seen in LWS observations of extended sources, is observed in the corrected W28A2 spectrum (fringing is discussed in Section 2.3 and in Section 6.2).
This non-linear flux response correction is applied to LW1 and LW2-LW4, i.e. one unstressed detector and three of the four stressed detectors. Table 5.8 gives the instrument responsivity for each LWS detector, as reported in Swinyard et al. 2000, [41] grouped according to detector type (also see Section 2.6 for bias voltages). The responsivity of LW1 is 3-4 times greater than that of the other unstressed Ge:Ga detectors. This high responsivity is the cause of the non-linearity and explains why this detector requires the correction. The responsivities of detectors LW2-LW4 are also high, but that of the last stressed detector, LW5, is much lower (by a factor of 3-8). Due to this low responsivity, LW5's data do not suffer noticeably from non-linearity and hence do not require the correction. Section 6.10 explains how to decide if your data need the correction, how to get them corrected and the procedure that is followed.
| Detector | Type | Responsivity [A/W] |
| SW1 | Ge:Be | 0.132 |
| SW2 | Ge:Ga(u) | 0.070 |
| SW3 | Ge:Ga(u) | 0.094 |
| SW4 | Ge:Ga(u) | 0.084 |
| SW5 | Ge:Ga(u) | 0.078 |
| LW1 | Ge:Ga(u) | 0.274 |
| LW2 | Ge:Ga(s) | 0.886 |
| LW3 | Ge:Ga(s) | 2.365 |
| LW4 | Ge:Ga(s) | 1.803 |
| LW5 | Ge:Ga(s) | 0.337 |