|
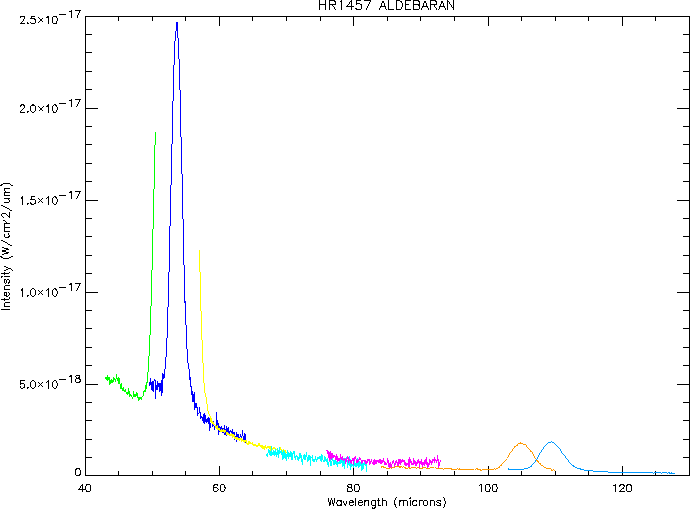
LWS spectra of stars that are bright in the near-infrared (NIR)
sometimes contain
features which resemble broad spectral features, but which do not
occur at the same wavelength in detectors which cover the same range
(see an example in Figure 6.5).
The origin of these features is believed to be a near-infrared leak
in the blocking filters located in front of the detectors. This
supposition is supported by a statistical test, which showed a
correlation between these features and the brightness in the
J, H, and K near-infrared photometric bands. The
strength of these features is best correlated with the strength of the
sources in the H-band (1.6![]() m).
In a small sample of post-main-sequence
stars observed in the Core Programme, all those which had an H-band
emission brighter than about 2.2 magnitudes (around 140Jy)
were seen to exhibit these spurious features.
m).
In a small sample of post-main-sequence
stars observed in the Core Programme, all those which had an H-band
emission brighter than about 2.2 magnitudes (around 140Jy)
were seen to exhibit these spurious features.
Follow-up observations of one of the affected sources gave results consistent with a near-IR leak as the origin of the features. The spurious features are now known to be reproducible, in terms of wavelength, shape and FWHM from one source to another and for repeated observations of the same source. This means that a template profile can be created which observers can fit to their data and use to remove the spurious features. To first order the profile is Gaussian for each of the three most-affected detectors: SW2, LW1 and LW2. The short-wavelength wing of a similar feature also affects the longest-wavelengths of detector SW1's range, while the long-wavelength wing of a spurious feature affects the shortest wavelengths of detector SW3's range. The best estimates of central wavelength and FWHM of the Gaussians are given in Table 6.1.
| Detector | Peak wavelength | FWHM |
| [ |
[ |
|
| SW2 | 53.60 | 1.86 |
| LW1 | 105.08 | 4.30 |
| LW2 | 109.39 | 3.91 |
| SW1 | 51.6 | 2.4 |
| SW3 | 52.2 | 4.0 |
Using these parameters, it has proved possible to effectively remove these spurious features and to detect narrow emission lines that were undetectable before.
Based on the small number of affected sources in the Core Programme, we can offer the following estimates:
LWS observations affected by the near-IR leak have now been corrected from the features and the corrected spectra are available as `Highly Processed Data Products' (HPDP) from the ISO Data Archive.