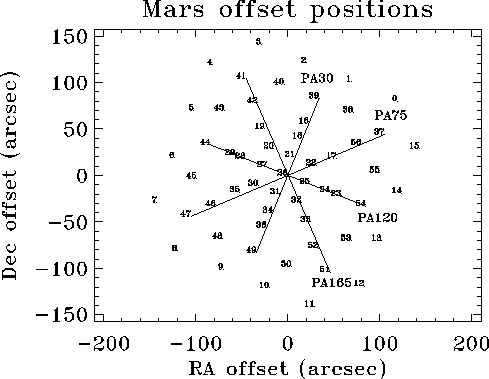
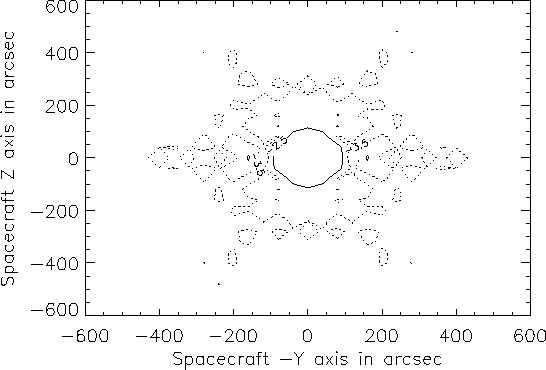
The beam profile has been derived from a series of standard bias, grating scan observations of Mars. One observation was made on-axis and the others were distributed around the field as shown in Figure 5.16. The flux at three wavelengths in each detector, at each of the raster positions, are used to describe the radial sensitivity of the instrument and a parameterisation defines the beam profile. In addition subsets of the data along the four radial alignments, which are labelled PA30, PA75, PA120 and PA165 on Figure 5.16, have been analysed to investigate possible asymmetries in the beam profile.
Before discussing the beam profile it is important to appreciate the
properties of the optical path leading to the LWS detectors as these
have a profound impact on the beam profile.
The optical train of the LWS consist of the contour field mirror that
allows a beam of
![]() 120
120
![]() to fall on the complex mirror M2, which is
inclined at
to fall on the complex mirror M2, which is
inclined at ![]() 22
22![]() to the incoming beam. M2 diverts the beam
by
to the incoming beam. M2 diverts the beam
by
![]() 44
44![]() back through a semi-cylindrical cut-out in the
contour
field mirror and then presents
an elliptical beam of
back through a semi-cylindrical cut-out in the
contour
field mirror and then presents
an elliptical beam of ![]() 105
105 ![]() 97
97
![]() (nominal FWHM) to the collimator,
the LWS entrance pupil, the re-imaging mirror and detectors. Immediately
in front of each detector is a rectangular aperture with rounded ends,
which when projected onto the sky is approximately elliptical with
dimensions of 104
(nominal FWHM) to the collimator,
the LWS entrance pupil, the re-imaging mirror and detectors. Immediately
in front of each detector is a rectangular aperture with rounded ends,
which when projected onto the sky is approximately elliptical with
dimensions of 104 ![]() 157
157
![]() at SW1 and
138
at SW1 and
138 ![]() 131
131
![]() at LW5 in the directions along and across dispersion respectively. The
long and short axes of M2 projected onto the sky are PA30 and PA120 (Y
and Z axes) respectively.
at LW5 in the directions along and across dispersion respectively. The
long and short axes of M2 projected onto the sky are PA30 and PA120 (Y
and Z axes) respectively.
As the detector apertures are nominally larger than the incoming beam
from M2 it is, in fact, M2 that defines the aperture of the detectors,
and the character of the optics determines the instrumental profile.
Perversely, the substrate that supports M2 is also reflective,
particularly at longer wavelengths, and is now believed to be responsible
for the fringing that is seen in off-axis targets. A second
consequence of this is that the instrumental profile will have weak wings
out to ![]() 120
120
![]() diameter (the size of the contour
field mirror).
diameter (the size of the contour
field mirror).
The other feature of LWS grating spectra of objects observed off-axis is the poor stitching between adjacent detectors, which is often referred to as fracturing. The problem is apparently worse for objects in the part of the field that passes close to the cut-out in the contour field mirror. The origin of this problem is unknown but it introduces a complex, wavelength-dependent asymmetry into the instrumental profile. These problems are described in more detail in Sections 6.2 and 6.3.
The observed beam profile is the result of the convolution of the
telescope PSF and the instrumental profile of each detector. Ideally the
telescope PSF would be an Airy profile but the central obscuration and
secondary supports, and any optical imperfections will conspire to
redistribute power from the core of the profile to the Airy rings.
Although a point source is being used to probe the structure of the beam,
the width of the PSF, which is essentially an Airy profile, increases
from ![]() 25 to 100
25 to 100
![]() (FWHM) between 46
(FWHM) between 46![]() m and
178
m and
178![]() m, and at the longer wavelengths becomes comparable with
the size of the beam. Due the problems of fracturing and fringing the
true shape of the instrumental profile is largely unknown.
m, and at the longer wavelengths becomes comparable with
the size of the beam. Due the problems of fracturing and fringing the
true shape of the instrumental profile is largely unknown.
|
To determine the effective beam size the observed fluxes at three wavelengths in each detector have been compared with those derived from a convolution of the telescope PSF with apertures of various sizes. The latest model of the telescope PSF includes the effects of the central obscuration and its supporting structure, and indicate that the power in the Airy rings is increased and that the wings of the profile contain 2-D structure. The asymmetry introduced into the profile is due to the three-legged secondary support. The aperture has been assumed to be circular with a rectangular profile.
It has previously been recognised that the effective apertures are
significantly smaller that the nominal value of 100
![]() ,
based on the size of the beam from M2. The best value for
most of the detectors lies close to 80
,
based on the size of the beam from M2. The best value for
most of the detectors lies close to 80
![]() ,
and for LW3, LW4 and LW5 is somewhat
smaller than this. At the longest wavelengths the width of the telescope
PSF is larger than the aperture itself which makes these determinations
more difficult. An uncertainty of one arcsec in the radius
corresponds to about 5% in the effective area of the aperture.
,
and for LW3, LW4 and LW5 is somewhat
smaller than this. At the longest wavelengths the width of the telescope
PSF is larger than the aperture itself which makes these determinations
more difficult. An uncertainty of one arcsec in the radius
corresponds to about 5% in the effective area of the aperture.
Also, although a simple circular aperture has been adopted, more complex shapes can provide a better description of the asymmetries, under some circumstances. However, the range of possible shapes and number of free parameters makes this approach untenable.
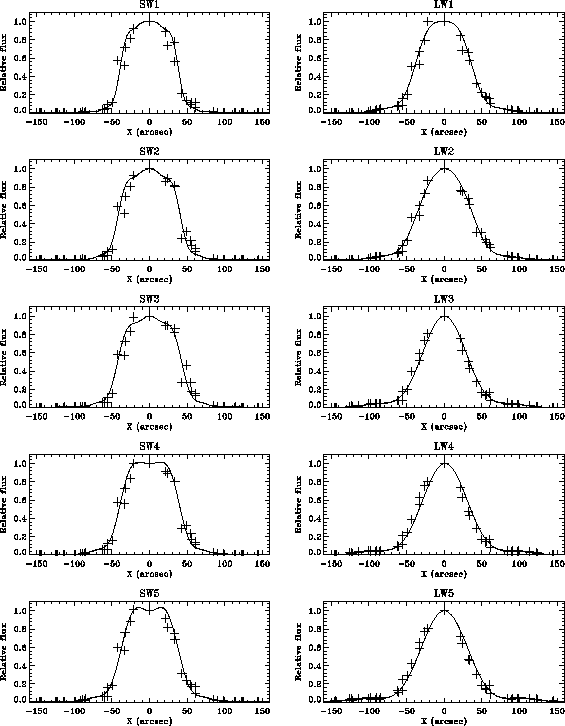
The relative flux at each of the observed offset positions (see Figure 5.16) is shown for each detector in Figure 5.17 with the convolution of the telescope PSF and the best fit composite aperture superimposed. At shorter wavelengths the telescope PSF is narrow enough to probe the structure of the rectangular (top hat) instrumental profile and some indication of its shape can be seen. As the telescope PSF broadens towards longer wavelengths the details of the instrumental profile become washed out and the observed profile becomes more Gaussian.
The resulting estimates for the effective beam size for each detector are given in arcsec in Table 5.9.
The effective solid angle of the detectors is required to determine the point/extended source flux correction, for the conversion of observed flux to flux per steradian for extended sources and for the calibration of sources observed in parallel and serendipity mode (see Table 5.10).
It is already clear from Figure 5.17 there is some asymmetry in the beam profile, with groups of points lying systematically off the lines. The question of symmetry is not straightforward, and a simple analysis of the relative mean fluxes for the four radial alignments begins to show this.
Each of the radial alignments is a subset of the data which define the
global mean profile. The four alignments are separated by approximately
45 ![]() to create two orthogonal pairs, with the PA30 set aligned
along the Y axis, and the PA120 set aligned along the Z axis of M2.
A Gaussian profile constrained
to the optical axis was fitted to each set with the on-axis point and
those with
to create two orthogonal pairs, with the PA30 set aligned
along the Y axis, and the PA120 set aligned along the Z axis of M2.
A Gaussian profile constrained
to the optical axis was fitted to each set with the on-axis point and
those with
![]() excluded. Although each alignment
contains nine
points, only six points are used in the PA30 and PA120 solutions and only
four points in the PA75 and PA165 solutions.
excluded. Although each alignment
contains nine
points, only six points are used in the PA30 and PA120 solutions and only
four points in the PA75 and PA165 solutions.
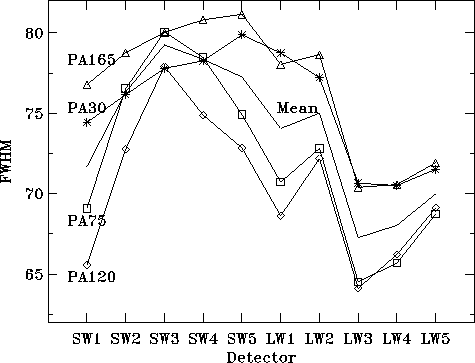
Of the parameters derived from these solutions the FWHM is probably the most reliable, and this is shown in Figure 5.18 for the different detectors. Although there is considerable scatter the behaviour is fairly consistent. Each alignment shows an increase in FWHM through the SW detectors and then a subsequent decline, which reflects the behaviour of a Gaussian fit to all the data, and the run of effective aperture sizes in the table above. In more detail it can be seen that the alignments fall naturally into two pairs with very similar behaviour. PA75 and PA120 show much more variation than PA30 and PA165, and peak at SW3 as opposed to SW5. In particular PA75 and PA120 run through the fractured region; see the spectra in Figure 6.3 of raster positions 27 and 30 in Figure 5.16.
The LWS flux scale is based on a point source calibration, although beyond
the diffraction limit at about 110 ![]() m a substantial fraction of the
flux from an on-axis point source is diffracted out of the aperture. In
fact there are significant diffraction losses for all LWS detectors but
provided the calibration is applied to point sources observed on-axis
these losses are irrelevant because they are cancelled out in the
calibration
process. However, for extended sources the
diffraction losses do not occur and so a correction has to be applied to
correctly place the derived fluxes on the point source calibration
scale.
The correction factor to apply to the fluxes in case of extended
sources has been calculated at three wavelengths per detector.
These factors are given as
m a substantial fraction of the
flux from an on-axis point source is diffracted out of the aperture. In
fact there are significant diffraction losses for all LWS detectors but
provided the calibration is applied to point sources observed on-axis
these losses are irrelevant because they are cancelled out in the
calibration
process. However, for extended sources the
diffraction losses do not occur and so a correction has to be applied to
correctly place the derived fluxes on the point source calibration
scale.
The correction factor to apply to the fluxes in case of extended
sources has been calculated at three wavelengths per detector.
These factors are given as ![]() in Table 5.10.
in Table 5.10.
To convert the observed flux of an extended source to flux per steradian
requires both the extended source correction factor (![]() , see above)
and the effective aperture in steradian explicitly.
, see above)
and the effective aperture in steradian explicitly.
| Detector | r |
|
||
| 43.0 | 0.8721 | 39.3 | 0.1140 | |
| SW1 | 46.2220 | 0.8704 | 39.4 | 0.1146 |
| 50.0 | 0.8691 | 39.4 | 0.1146 | |
| 50.0 | 0.8705 | 42.6 | 0.1340 | |
| SW2 | 56.2033 | 0.8677 | 42.3 | 0.1321 |
| 60.0 | 0.8563 | 42.1 | 0.1308 | |
| 60.0 | 0.8634 | 43.5 | 0.1397 | |
| SW3 | 66.1173 | 0.8421 | 43.7 | 0.1410 |
| 70.0 | 0.8127 | 43.4 | 0.1390 | |
| 70.0 | 0.7845 | 41.2 | 0.1253 | |
| SW4 | 75.6989 | 0.7334 | 40.7 | 0.1223 |
| 80.0 | 0.7118 | 40.9 | 0.1235 | |
| 80.0 | 0.6904 | 38.4 | 0.1088 | |
| SW5 | 84.7977 | 0.6878 | 39.7 | 0.1163 |
| 90.0 | 0.6803 | 40.3 | 0.1199 | |
| 90.0 | 0.6753 | 38.3 | 0.1083 | |
| LW1 | 102.425 | 0.6758 | 38.8 | 0.1111 |
| 108.0 | 0.6757 | 38.6 | 0.1100 | |
| 108.0 | 0.6761 | 39.6 | 0.1157 | |
| LW2 | 122.218 | 0.6734 | 39.1 | 0.1128 |
| 130.0 | 0.6557 | 38.1 | 0.1071 | |
| 130.0 | 0.6445 | 36.5 | 0.0983 | |
| LW3 | 141.809 | 0.6035 | 35.6 | 0.0935 |
| 150.0 | 0.5623 | 34.3 | 0.0868 | |
| 150.0 | 0.5727 | 35.3 | 0.0920 | |
| LW4 | 160.554 | 0.5411 | 35.0 | 0.0904 |
| 170.0 | 0.4855 | 33.9 | 0.0848 | |
| 170.0 | 0.5002 | 34.3 | 0.0868 | |
| LW5 | 177.971 | 0.4596 | 33.6 | 0.0833 |
| 195.0 | 0.3749 | 31.6 | 0.0737 |
The corrected extended source flux for an observed flux ![]() given in Jy is
given in Jy is
![]() MJy/sr, where
MJy/sr, where ![]() is
the extended source correction and
is
the extended source correction and ![]() is the
effective solid angle of the beam in sr.
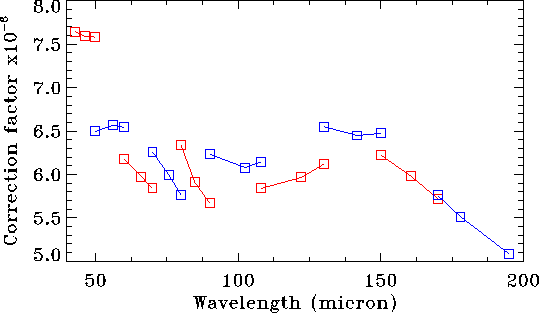
These values are now given at three different wavelengths per detector
(from Version 2.1 of this volume of the ISO Handbook on). As visible on
Figure 5.19,
for most detectors the resulting correction factor presents a gradient
with wavelength. This
has the positive consequence that with this correction there is a better
agreement between the corrected fluxes of extended sources in the overlap
regions between detectors.
is the
effective solid angle of the beam in sr.
These values are now given at three different wavelengths per detector
(from Version 2.1 of this volume of the ISO Handbook on). As visible on
Figure 5.19,
for most detectors the resulting correction factor presents a gradient
with wavelength. This
has the positive consequence that with this correction there is a better
agreement between the corrected fluxes of extended sources in the overlap
regions between detectors.
|
An LIA routine has been provided that applies this correction to averaged,
de-fringed LSAN files called EXTENDED_FLUX.
However, these corrections are derived under the
assumption of a smooth and very extended flux distribution. In the real
world, structured or embedded sources could produce significant
discrepancies from the ideal situation, and, with it, differences in flux.
|
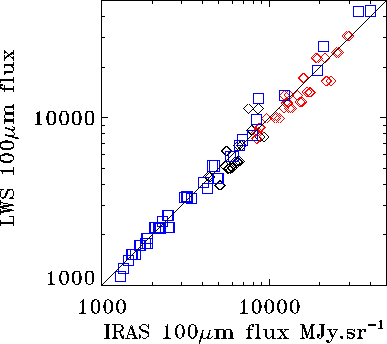
LWS observations have been made at a number of positions in the Trumpler
14 and 16, and Galactic Centre fields and these have been compared
with the IRAS 100 ![]() m
fluxes at the same positions. Both fields contain a large area of
extended emission, which although relatively smooth, does change by a
factor of
m
fluxes at the same positions. Both fields contain a large area of
extended emission, which although relatively smooth, does change by a
factor of ![]() 40 over all. Figure 5.20
shows the comparison of the converted LWS and IRAS 100
40 over all. Figure 5.20
shows the comparison of the converted LWS and IRAS 100 ![]() m fluxes using
the current LWS calibration. These measurements give a mean ratio,
LWS/IRAS
m fluxes using
the current LWS calibration. These measurements give a mean ratio,
LWS/IRAS ![]() 1.0
1.0![]() 0.1. Ideally for this comparison the extended
flux should be distributed as evenly as possible, and part of the
uncertainty is probably due to unresolved structure within the beam.
0.1. Ideally for this comparison the extended
flux should be distributed as evenly as possible, and part of the
uncertainty is probably due to unresolved structure within the beam.
For fields containing multiple sources the observed flux will depend critically on the precise positions of the sources relative to the optical axis. To recover or model the observed flux will require positional information on the sources and a deconvolution with the telescope PSF and instrumental profile. Indeed, for single point sources observed off-axis a similar procedure will be required to recover the correct flux.
A complete study of the beam profile of the LWS has been performed only for distances within 150" of the central source. Rasters of larger extent would have been too time-consuming. There were, however, spot checks of the flux entering the instrument at even larger distances from a very strong source: The off-position spectra for Ganymede and Callisto. They provide us with the fluxes from Jupiter, when the aperture of the LWS was pointed at distances of 5' and 9' from this planet. The results are shown in Table 5.11 and compared to the fluxes expected from a model of the PSF by Okumura 2000, [30]; see Figure 5.21.
| SW2 | model | LW2 | model | ||
| Distance | Angle to S/C Z |
|
|
|
|
| [arcsec] | [ |
|
|
|
|
| 282 | 38 | 860 | 77 | 1100 | 406 |
| 291 | 325 | 440 | 94 | 890 | 125 |
| 530 | 113 | 84 | 14 | 300 | 66 |
| 532 | 20 | 38 | 0.1 | 100 | 25 |
| 535 | 2 | 27 | 5.5 | 52 | 8 |
| 537 | 148 | 73 | 13 | 350 | 26 |
| 545 | 344 | 53 | 2.8 | 190 | 52 |
The significance of the correlation between the measured flux and the
model PSF is 2.4 ![]() for detector SW2 at 56
for detector SW2 at 56 ![]() m and 2.6
m and 2.6 ![]() for detector LW2 at 122
for detector LW2 at 122 ![]() m. The correlation between flux and
distance or angle alone is much weaker, hence the model PSF reflects
correctly the observed flux pattern up to a distance of 9
m. The correlation between flux and
distance or angle alone is much weaker, hence the model PSF reflects
correctly the observed flux pattern up to a distance of 9![]() from the source. On the other hand the measured fluxes are systematically
higher than what is expected from the optical model, which could be due
either to the fact that Jupiter is not a point source or to the existence
of significant wings in the beam profile.
from the source. On the other hand the measured fluxes are systematically
higher than what is expected from the optical model, which could be due
either to the fact that Jupiter is not a point source or to the existence
of significant wings in the beam profile.
|