

Next: 5.12 Fabry-Pérot Wavelength Calibration
Up: 5. Calibration and Performance
Previous: 5.10 Grating Wavelength Calibration
Subsections
5.11 Grating Resolution and Characterisation of the Line
Profiles
The study of the grating profile was performed with data obtained
over the ISO lifetime for wavelength calibration (see
Table 5.12 and Figure 5.22).
In order to have a homogeneous sampling, only those data obtained with
AOT L01, an oversampling of 8,
6 scans of the full grating range and the same number of forward and backward
scans were used.
The data processing was performed with the ISAP software. The standard
processing of the selected observations is summarized by the following
scheme:
- For each object we selected up to 20 observations well
spread all over the mission.
- Each individual scan was checked for the presence of
glitches or any anomalous feature. Glitches were removed
and anomalous scans discarded.
- Each scan was rebinned to 32 points per resolution element.
- Forward and backward scans were averaged separately.
- In the case of extended sources, the resulting scans were
corrected for the presence of fringes.
- The continuum was fitted by a polynomial and subtracted off.
- The profile was normalised so that the peak of all profiles
was one.
- The resulting spectra were re-centred to the laboratory
wavelength, so that profiles from different velocity sources
can be compared.
The products were thus one spectrum per scan direction per spectral line
per detector per observation per object.
5.11.2 Stability of the line profiles
In order to define as general a profile as possible,
parameters susceptible of inducing
profile variations were looked for in a step by step approach.
When a parameter had proved not to induce any significant variation,
the profiles were averaged over this parameter for the subsequent study.
- Stability with time.
All observations of the same line on the same detector for the
same object were plotted together to look for time variations.
The peak to peak variations in the peak height of the line were
as low as 2% for the strong lines and always less than 20% in the worst
cases corresponding to the faintest lines used. No trend was found with time
so these numbers are representative of the photometric accuracy
of the LWS detectors. The variation of the
line width with time is in general much smaller than the sampling
interval of the observations (8 points per resolution element).
We concluded that there are no
significant time variations in the instrumental profiles.
- Search for transient effects: comparison of forward
and backward scans.
Slight differences do exist between the forward and backward
scans of the same line from the same object due to transient or
memory effects. In the short wavelength detectors the difference
in the peak is always less than
 , while in the long
wavelength detectors it can be up to
  .
There is no trend with the flux level.
In the base of the line some broadening can be observed,
in general on the short wavelength side for forward scans and on the long
wavelength side
for backward scans. The opposite case is also seen though, possibly due
to errors in placing the continuum.
Because the effect is symmetrical when adding the forward and backward scans
together, and because most of the differences between
forward and backward scans are seen in the feet of the line, where
they are confused with continuum features and thereby will be removed
by the baseline subtraction process, our recommendation, as long as no
formal transient correction is available,
is to use both scan directions together.
We have thus averaged forward and backward
profiles for the rest of the study.
- Variation of line profile with object and detector.
In general the profiles show very little difference from object to object
(the differences are less than 4%) and they show no significant differences
between lines coming from different detectors.
There is one exception with the clearly anomalous line at  m on
detector SW2. It shows a strong asymmetry towards
the short wavelengths for some objects. The asymmetry is clearly not real
because it does not appear when the same line is observed with the
detector SW3.
It is not due to the detector either, as two other lines falling on SW2
(at
  m and
m and  m) do not show any anomaly.
The
  m line on detector SW2 has thus been excluded from the
derivation of the mean
profile obtained by averaging all lines from all detectors in all objects.
- Difference in line profiles from point and extended sources.
The profiles from extended sources and from
point sources were kept separate to check wether
off-centred emission was creating any distortion in the line profiles.
The comparison of the mean profiles shows that, if anything, the
profiles from the extended sources are more symmetrical and more similar
to Gaussians than the point source profiles.
We thus concluded that there is no distortion coming from the source
extension or off-centring and we have averaged all profiles from point
sources and
extended sources together.
In conclusion, we have created two mean grating profiles (one for SW and
one for LW detectors) which are
the average of all lines listed in
Table 5.12 except the 57  m line on SW2.
5.11.3 Characteristics of the profiles. Comparison to Gaussians.
When considering all the LWS optical elements and detector
characteristics, the wavelength response function is not expected to be
Gaussian. It is however always convenient when measuring a line intensity
to be able to use a Gaussian aproximation.
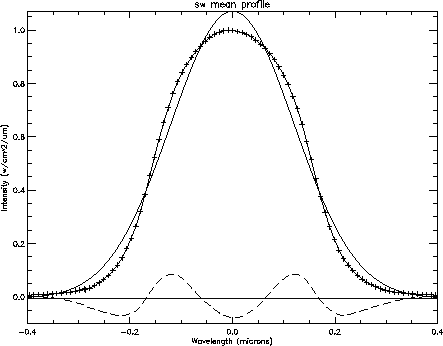
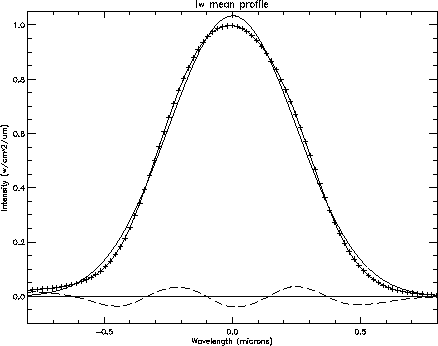
Figure 5.24:
Measured grating profiles (plus signs) and comparison
with a Gaussian fit
(solid line). The residuals, i.e. the difference between
the measured profile and the Gaussian fit, are also shown
(dashed line). Up: profile for short wavelength
detectors (SW1 to SW5) ; down: profile for long wavelength
detectors (LW1 to LW5).
|
|
Figure 5.24 shows the comparison of
the measured mean profiles with a Gaussian function fitted to them. It
also shows the residuals, i.e. the differences between the two profiles.
Table 5.16 lists the line flux, full width at half maximum
(FWHM) and peak heights both for the measured profiles and for the fitted
Gaussian.
This shows that the error made on the determination of the flux
with a Gaussian fit is only of the order of  .
.
Table 5.16:
Parameters of the measured grating profiles compared
with the results of Gaussian fits.
| |
Observed mean profile |
|
Gaussian fit to the mean profile |
| |
FWHM |
line flux |
height |
|
FWHM |
line flux |
height |
| |
[ m] m] |
(normalised |
|
|
[ m] m] |
(normalised |
|
| |
|
to peak=1) |
|
|
|
to peak=1) |
|
|
SW detectors |
 |
 |
1.00 |
|
 |
 |
 |
| |
|
|
|
|
|
|
|
| LW detectors |
 |
 |
1.00 |
|
 |
 |
 |
The line full widths at half maximum that we measure on our profiles
are slightly larger than those measured
before launch: 0.31 instead of 0.29 for the short wavelength detectors, and
0.61 instead of 0.60 for the long wavelength detectors. This is likely
due to the broadening effect of transients.
5.11.4 Effect of a lower spectral sampling
The above study of the line profile has been conducted with the
highest oversampling permitted in the observations, an oversamping of 8,
i.e. eight points per
spectral element.
However, in AOTs L01 and L02, four different oversamplings
were permitted: 8, 4, 2 and 1. Following the Nyquist
theorem, an oversampling of two or higher allows derivation of the line flux
with a precision better than 5% (a sampling of 1 point per spectral
resolution element would be clearly insufficient). However, we would like to
warn the user that a Gaussian fit
to observations obtained with an oversampling of 2 or even 4 might
give results with a higher error than the one quoted above for
an oversampling of 8. This is due to the fact that when a line is
scanned quickly, the transient effects are more important and tend to
broaden the line. This effect should be reduced once a transient correction
(Section 6.9) is available.


Next: 5.12 Fabry-Pérot Wavelength Calibration
Up: 5. Calibration and Performance
Previous: 5.10 Grating Wavelength Calibration
ISO Handbook Volume III (LWS), Version 2.1, SAI/1999-057/Dc

