The best way to correct the transient effects in spectra would have been to handle a complete physical model of each detector as well as a complete knowledge of the detector illumination in all observing conditions (see Coulais & Fouks 2001, [10]). However, there was no such model available for LWS detectors.
|
Some attempts to derive a physical model of Ge:Ga photo-conductors were done in the PHT and LWS teams before ISO launch, which were not conclusive. The use of an empirical solution has been proposed, based on the standard Fouks-Schubert model (see Fouks & Schubert 1995, [17] and references therein) derived for Si:Ga detectors, and used with success for CAM and PHT-S detectors (Coulais & Fouks 2001, [10]; Coulais et al. 2001, [11]) and for some SWS detectors (Kester 2001, [22]). The detailed report of the transient study in LWS is given in Caux 2001, [5].
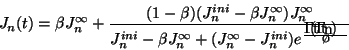
In order to implement this solution the formalism of the usual Fouks-Schubert model (Fouks & Schubert 1995, [17]), has first been adapted to the specific LWS case. The original Fouks-Schubert model is written for semi-stationary fluxes. For photometric instruments, as CAM and PHT, this assumption is valid. This is not really the case for the LWS spectrometer, for which the flux varies almost continuously. However, generally the flux change from one step to the other is small and one can consider the semi-stationary state valid, assuming each step of the spectrometer to be a new constant flux level. The original Fouks-Schubert formula can then be rewritten into a more suitable form for LWS as:
Where ![]() is the observed signal at the instant
is the observed signal at the instant ![]() ,
,
![]() is the expected signal if no transient effects were
present,
is the expected signal if no transient effects were
present,
![]() is the observed flux just after the change
at the time
is the observed flux just after the change
at the time ![]() and
and ![]() is a time `constant' which depends
on the detector
(we will see later that in the LWS case,
is a time `constant' which depends
on the detector
(we will see later that in the LWS case, ![]() is not constant).
We also have the continuity equation:
is not constant).
We also have the continuity equation:
We have tried different forms of ![]() and the best results, in terms
of quadratic difference between forward and backward scans, were obtained
with:
and the best results, in terms
of quadratic difference between forward and backward scans, were obtained
with:
where ![]() ,
, ![]() and
and ![]() are free parameters which are
intrinsic for each detector. One can note that the main difference with the
original Fouks-Schubert relation is the dependence of
are free parameters which are
intrinsic for each detector. One can note that the main difference with the
original Fouks-Schubert relation is the dependence of ![]() with the
signal gradient and not with the signal value. The second order equation
implies two solutions for the transient corrected intensity, among which
we always chose the one closest to the non-corrected value as for most
observations we do not expect a very strong correction.
with the
signal gradient and not with the signal value. The second order equation
implies two solutions for the transient corrected intensity, among which
we always chose the one closest to the non-corrected value as for most
observations we do not expect a very strong correction.
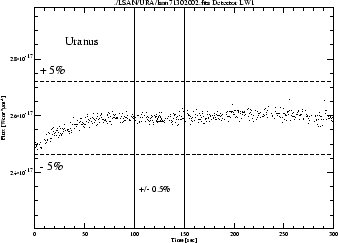
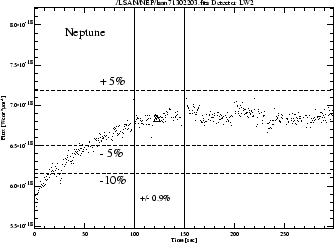
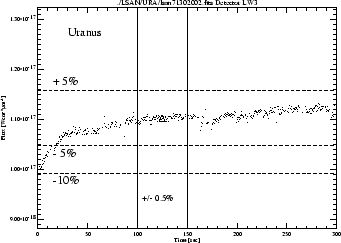
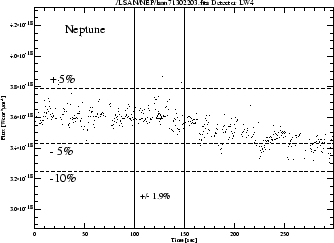
In order to fully calibrate the transient-corrected spectra, we have derived
a transient-corrected RSRF, derived as the original RSRF
(Section 5.2) but based on transient-corrected
observations of Uranus (see Caux 2001, [5] for more details).
The differences between the transient-corrected RSRF and the original RSRF
are of the order of ![]() 2%.
2%.
A dedicated LIA routine has been written to allow the user to correct LWS spectra for transient effects in the case of grating observations. It is not yet implemented in the current LIA (Version 10.1) but will be in one of the next LIA releases. This routine uses the SPD products as the correction should be applied on the time series. It requires to average previously the scans (forward and backward scans separately) to ensure a good signal-to-noise level of the data to be corrected. We have checked that generally the differences seen on scans performed in the same direction are only due to noise. Sometimes, the first forward and backward scans are affected by long term transient effects (due to a prior observation of a very bright source for example), and require to be entirely zapped. It also requires a previous very careful deglitching of the data as the presence of remaining glitches can seriously hampered the correction process.
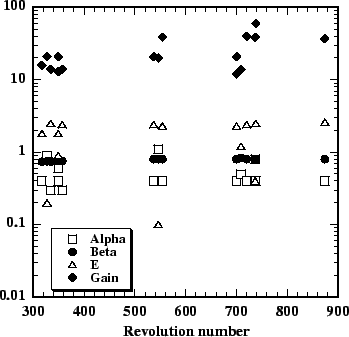
The best ![]() ,
, ![]() and
and ![]() parameters are computed for
each
observation, using the criterion that the signal recorded on forward and
backward scans should be equal. The observed difference is hence supposed to
be the signature of the
transient effects which are different in the two scanning directions,
due to the asymmetrical spectral shape of the bandpass filters located
in front of the detectors or to a gradient in the spectrum.
parameters are computed for
each
observation, using the criterion that the signal recorded on forward and
backward scans should be equal. The observed difference is hence supposed to
be the signature of the
transient effects which are different in the two scanning directions,
due to the asymmetrical spectral shape of the bandpass filters located
in front of the detectors or to a gradient in the spectrum.
The procedure then applies the correction simultaneously to the forward and backward averaged scans, and produces two transient-corrected spectra, one forward and one backward, which can be compared to judge how well the correction performed, and which have to be further averaged together to produce the final transient-corrected spectrum.
The LIA routine that finds the best Fouks-Schubert parameters has been tested on a wide set of different observations and was found to be stable.
|
| Detector | SW1 | SW2 | SW3 | SW4 | SW5 | LW1 | LW2 | LW3 | LW4 | LW5 |
|
|
0.6679 | 0.5161 | 0.7788 | 0.7707 | 0.7000 | 0.5224 | 0.5382 | 0.4251 | 0.4412 | 0.5346 |
| 0.82 | 0.8971 | 0.9233 | 0.9033 | 0.9367 | 0.94 | 0.774 | 0.74 | 0.7942 | 0.9491 |
The data improvement (in terms of quadratic difference between forward and backward scans) is important for detectors presenting large memory effects (SW1, LW2 and LW3), and is smaller for the others, particularly for non-stressed Ge:Ga detectors. This improvement depends as well on the type of source observed: extended sources with large fringing are subject to a much larger improvement than point sources.
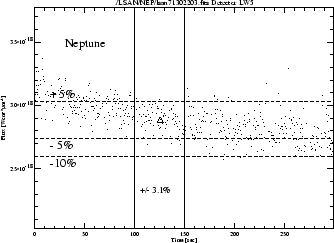
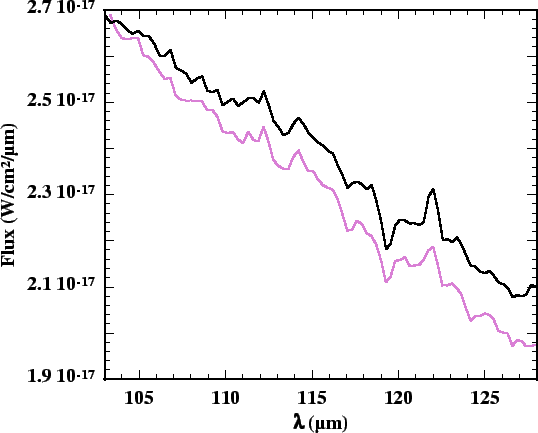
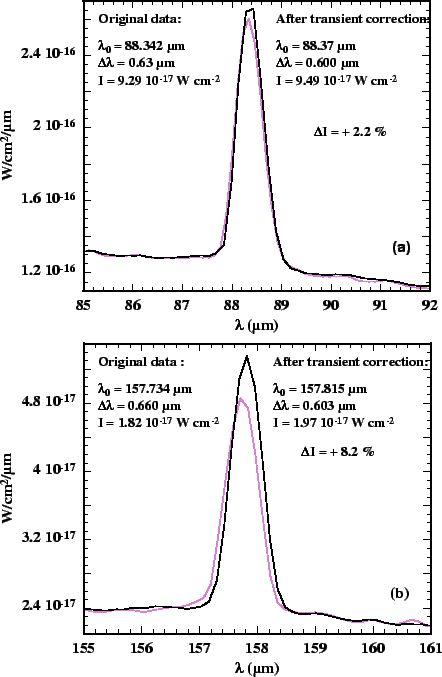
The validity of the correction has been tested on different types of astronomical sources. Figure 6.9 shows the effect of the correction on an extended source (galactic line of sight). One can note a small improvement at small scale, the remaining effects at large scale are supposed to be due to the imperfect defringing. One can also note the difference in the absolute level of the flux, which has an incidence on the stitching of the detectors.
|
|
Fabry-Pérot observations with LWS were always performed (for routine observations) by scanning the spectrum in only one direction. This prevents the use of the forward and backward scan differences to derive the correction parameters. We are presently working on a dedicated LIA routine to correct FP observations interactively, which will require some inputs from the observer, as the astronomical source line shape and width. This will always make the correction observer-dependent.