Much effort has been made to model the response of the ISOCAM array based on the theoretical understanding of infrared detectors (Abergel et al. 1999, [1]; Coulais & Abergel 2000, [21], and references therein) and sophisticated data reduction techniques have been developed to take into account some aspects of the ISOCAM response (Starck et al. 1999a, [58]; Désert et al. 1999, [29]; Aussel et al. 1999, [4]; Altieri et al. 1999, [3]). These methods are close to being optimal for the detection of point sources. Nevertheless, in many observations, instrumental effects still prevent the study of faint extended emission.
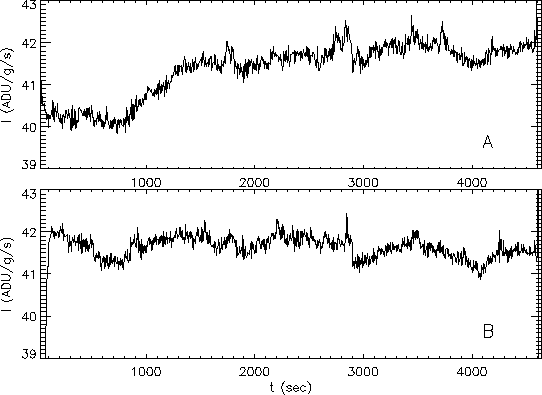
To be able to study extended emission, instrumental effects with variable time scales must be corrected. We present here a method that makes use of the spatial redundancy of raster-type observations to correct the Long Term Transient (LTT; see Figure F.1) and memory effects after glitches and strong point sources (see Figure F.2). The details are described in Miville-Deschênes et al. 2000, [41]. The processing steps here described are part of the so-called SLICE package, which is a standalone reduction package within IDL dedicated to the reduction of ISOCAM redundant observations. SLICE can also be used within CIA.
To illustrate these data processing techniques we will show in the following
two different
observations of the same field, the gamma-ray burst GRB 970402, obtained
sequentially in exactly the same configuration (LW10 filter,
![]() pfov) on revolution 506. The amplitude of the
instrumental
effects are not the same in both observations, giving us constraints on the
validity of the method (see Figure F.3).
pfov) on revolution 506. The amplitude of the
instrumental
effects are not the same in both observations, giving us constraints on the
validity of the method (see Figure F.3).
Another example showing the result of this type of processing, this time on an image of the ISOGAL survey is shown in Figure F.4 (Omont et al. 1999, [47]; Pérault et al. 1996, [49]).

|