Next: 4.9 Ghosts and Straylight
Up: 4. Calibration and Performance
Previous: 4.7 Spacecraft Pointing Jitter
Subsections
4.8 The Spectral Response Function of the CVF
The Spectral Response Function (SRF) has been measured for all
CVF segments using photometric calibration stars. The photometry of stars
observed in CVF mode was done as described for the filter photometry
(Section 4.1.1).
For the SW detector, only one star (HIC 96441) was used, for which four
individual CVF scan observations were available. For the LW detector,
several observations of four stars: Sirius, HIC 96441,  Draconis
and
Draconis
and  Draconis, were used for computing the SRF. The star fluxes
were derived using aperture photometry in all cases.
Special care was taken to avoid
the ghost reflection (see Section 4.9). The integrated
ghost flux can be up to a 30% of the star flux and can have a serious
impact on the observed spectrum. Thus, for CVF aperture photometry on
point sources, it is recommended to use the same apertures used for
the calibration standards: radii of 6, 4, 3 pixels for 1.5, 3 and
6
Draconis, were used for computing the SRF. The star fluxes
were derived using aperture photometry in all cases.
Special care was taken to avoid
the ghost reflection (see Section 4.9). The integrated
ghost flux can be up to a 30% of the star flux and can have a serious
impact on the observed spectrum. Thus, for CVF aperture photometry on
point sources, it is recommended to use the same apertures used for
the calibration standards: radii of 6, 4, 3 pixels for 1.5, 3 and
6
 pfov
respectively and a background determination in an annulus 2 pixels wide.
pfov
respectively and a background determination in an annulus 2 pixels wide.
Table 4.3:
Standard stars used for the derivation of
the CVF Spectral Response Function.
|
Name |
HIC |
HR |
HD |
SAO |
R.A. |
Dec. |
Spec. Type |
|
Draconis |
87833 |
6705 |
164058 |
30653 |
17:56:36.37 |
+51:29:20.0 |
K5III |
| Draconis |
94376 |
7310 |
180711 |
18222 |
19:12:33.30 |
+67:39:41.5 |
G9III |
| - |
96441 |
7469 |
185395 |
31815 |
19:36:26.54 |
+50:13:16.0 |
F4V |
| Sirius |
32349 |
2491 |
48915 |
151881 |
06:45:08.92 |
 16:42:58.0 16:42:58.0 |
A0m |
The total signals measured in detector units were divided by the stellar
flux densities (in Jy) predicted by stellar models (see also
Section 4.1). For this we need to consider that the
stars observed for the CVF
calibration have quite different stellar types. The spectra of the
earlier type stars are dominated by atomic lines whereas molecular bands
dominate the spectra of the cool stars. Thus, for the star HIC 96441 (F4V)
we used the Kurucz model provided by the Ground Based Preparatory
Programme
(Hammersley et al. 1998, [36]; Hammersley &
Jourdain de Muizon 2001, [37]), while for the other
three stars, with later spectral types, we used models provided by Decin
et al. 2003b, [27] up to 12  m and by
Cohen et al. 1995, [19] for the longer wavelengths.
For more details on the characteristics and limitations of the
different models used see Decin 2001, [25]. Their
usage for the CVF calibration is discussed in
Blommaert et al. 2001a, [12]; 2001b,
[13].
A weighted average of all the resulting SRF estimates was computed, after
carefully excluding measurements strongly affected by transient effects.
The final SRFs were smoothed using a 3-pole digital low-pass filter, with
a cut-off at 25%, in order to reduce the noise features (that could be
misinterpreted as spectral lines when the SRF is used to derive the
spectrum of a given object).
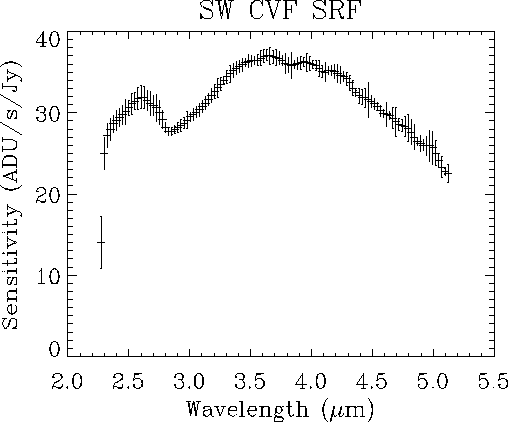
The derived SW CVF SRF is shown in Figure 4.20
together with the associated error bars, which do not include systematic
errors, i.e. due to `ghosts' (see Section 4.9).
The average random error of the SW CVF
SRF is
m and by
Cohen et al. 1995, [19] for the longer wavelengths.
For more details on the characteristics and limitations of the
different models used see Decin 2001, [25]. Their
usage for the CVF calibration is discussed in
Blommaert et al. 2001a, [12]; 2001b,
[13].
A weighted average of all the resulting SRF estimates was computed, after
carefully excluding measurements strongly affected by transient effects.
The final SRFs were smoothed using a 3-pole digital low-pass filter, with
a cut-off at 25%, in order to reduce the noise features (that could be
misinterpreted as spectral lines when the SRF is used to derive the
spectrum of a given object).
The derived SW CVF SRF is shown in Figure 4.20
together with the associated error bars, which do not include systematic
errors, i.e. due to `ghosts' (see Section 4.9).
The average random error of the SW CVF
SRF is  3%, but for some SW CVF positions the error can be as large
as 23%.
3%, but for some SW CVF positions the error can be as large
as 23%.
Figure 4.20:
The SW CVF SRF within its  confidence band,
where
confidence band,
where  is the rms derived from the set of
measurements used to obtain the SRF.
is the rms derived from the set of
measurements used to obtain the SRF.
|
|
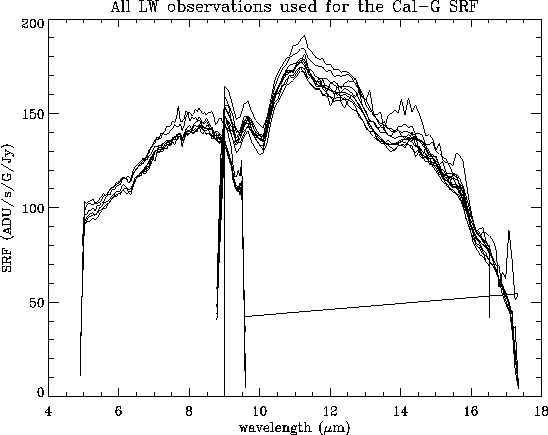
Before determining the average LW SRF, all measurements were corrected
for the change of responsivity in orbit (a decrease of 6% from start to end,
as was shown in Section 4.1.2). This correction
reduced the overall
rms from 4% to 3%. The observations divided by
their input spectra are shown in Figure 4.21.
The repeatability of the CVF photometry on the same star is
excellent,  3% rms.
Figure 4.21:
The different
LW SRF determinations based on the observations of 4 different
calibration stars. It includes different pfov measurements. The
rms is 3-4%.
|
|
The rms of the LW CVF1 SRF is 3% of the measured value, on average, and
always less than 5%, except for the CVF step positions of the shortest
(4.96  , rms = 11%) and the longest wavelength (9.58 ,
rms = 48%). Fortunately, the longest wavelength of LW CVF1
is also covered by the LW CVF2, with a much higher
accuracy. The mean rms of the CVF2 SRF is 4% of the measured value.
Originally, a wavelength range was offered to the observer from 9.003
to 16.52 m. The SRF at CVF positions outside the recommended
range is also available in the calibration files, but these are affected by
larger errors (still below 10% rms up to 17.16 m but up to more than
100% for the extreme position at 17.34 m). When analysing a CVF
spectrum of an astronomical target, the largest uncertainties come from the
reflected light (Section 4.9) and the long time needed
to stabilise the measured signal (Section 4.4)
which will affect mostly the beginning of a CVF measurement or when
there is a change between CVF segments.
The resulting
CVF SRFs and their error bars are given in the calibration files CSWCVF,
CLWCVF1 and CLWCVF1 (Sections 6.1.15 and
6.1.16).
The determination of the SRF of the LW CVF is described in detail in
Blommaert et al. 2001a, [12] and for the SW SRF in
Biviano et al. 1998b,
[6].
, rms = 11%) and the longest wavelength (9.58 ,
rms = 48%). Fortunately, the longest wavelength of LW CVF1
is also covered by the LW CVF2, with a much higher
accuracy. The mean rms of the CVF2 SRF is 4% of the measured value.
Originally, a wavelength range was offered to the observer from 9.003
to 16.52 m. The SRF at CVF positions outside the recommended
range is also available in the calibration files, but these are affected by
larger errors (still below 10% rms up to 17.16 m but up to more than
100% for the extreme position at 17.34 m). When analysing a CVF
spectrum of an astronomical target, the largest uncertainties come from the
reflected light (Section 4.9) and the long time needed
to stabilise the measured signal (Section 4.4)
which will affect mostly the beginning of a CVF measurement or when
there is a change between CVF segments.
The resulting
CVF SRFs and their error bars are given in the calibration files CSWCVF,
CLWCVF1 and CLWCVF1 (Sections 6.1.15 and
6.1.16).
The determination of the SRF of the LW CVF is described in detail in
Blommaert et al. 2001a, [12] and for the SW SRF in
Biviano et al. 1998b,
[6].
4.8.1 Spectral purity
From observations of planetary nebulae taken during the PV Phase, the
central wavelengths of two lines, [Ne II]  12.81 m
and [S IV] 10.51 m, were derived (by
simple Gaussian fitting over the continuum). They were found to fall
at the expected CVF scan positions, within a few hundredths of a CVF
step. Transient effects may slightly change the observed position of
the line, by less than a tenth of a CVF step.
However, the wavelength purity is reduced when the source is not centred at
the middle of the array. An analysis of the [Ne III] 15.55
m line central
position in an ISOCAM CVF image of M17 showed that the central
observed wavelength position of the [Ne III] line was red-shifted
0.09m at the left edge of the ISOCAM array compared to the
observed wavelength at the centre. At
the position of CVF2 corresponding to the wavelength of the [Ne III] line
such a shift corresponds to roughly one CVF step.
At the right edge of the ISOCAM array, however,
there is no significant wavelength shift.
On the other hand, there is no wavelength-dependence in the top-down
direction of the array, as expected from the orientation of the CVF
with respect to the array. In addition, there is an indication that
the wavelength shift is wavelength dependent, being larger at longer
wavelengths.
12.81 m
and [S IV] 10.51 m, were derived (by
simple Gaussian fitting over the continuum). They were found to fall
at the expected CVF scan positions, within a few hundredths of a CVF
step. Transient effects may slightly change the observed position of
the line, by less than a tenth of a CVF step.
However, the wavelength purity is reduced when the source is not centred at
the middle of the array. An analysis of the [Ne III] 15.55
m line central
position in an ISOCAM CVF image of M17 showed that the central
observed wavelength position of the [Ne III] line was red-shifted
0.09m at the left edge of the ISOCAM array compared to the
observed wavelength at the centre. At
the position of CVF2 corresponding to the wavelength of the [Ne III] line
such a shift corresponds to roughly one CVF step.
At the right edge of the ISOCAM array, however,
there is no significant wavelength shift.
On the other hand, there is no wavelength-dependence in the top-down
direction of the array, as expected from the orientation of the CVF
with respect to the array. In addition, there is an indication that
the wavelength shift is wavelength dependent, being larger at longer
wavelengths.
Next: 4.9 Ghosts and Straylight
Up: 4. Calibration and Performance
Previous: 4.7 Spacecraft Pointing Jitter
ISO Handbook Volume II (CAM), Version 2.0, SAI/1999-057/Dc