3.4.3) The PIA XSurface Window
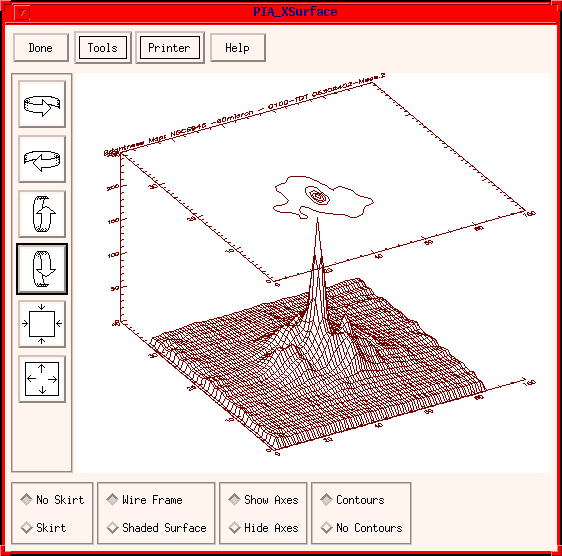
The PIA XSurface Window is used for 3-dimensional plots, e.g. for the signal or flux distribution of the PHT-C arrays. It is called context sensitive at several points of the PIA software. An example is shown in Figure 1.

FIGURE 1: The PIA XSurface Window (showing a three-dimensional view of a C100 map)
The row of buttons directly left of the graph allow the user to rotate the graph and to zoom in and out, thus allowing the perspective of the 3-D view to be changed.
The Done button closes the window.
From the Tools pull-down menu the standard IDL routines XLoadct and XPalette can be reached in order to change the colour settings. Please note that is necessary to reset to the standard IDL colour table afterwards, via the Customize item in the PIA Top Window, because otherwise PIA displays may show incorrect colour settings, like invisible data points.
The Print button is a menu button: a) Define printer calls the menu for printer setting and b) print image prints the graph in the currently selected perspective.
The buttons at the bottom of the PIA XSurface window allow the choice between three different display styles:
- Skirt/No Skirt: toggles between plotting the zero value of the plot and the suppression of the zero, i.e. setting the lowest plotted value to the lowest data value present.
- Wire Frame/Shaded Surface: Toggles between the wire frame or lego plot representation and the possibility of plotting the surface given by the data as a colour shaded representation. The latter is only useful in cases where there are enough data points present. In the case of the C array display the lego plot gives a better insight into the data structure.
- Show Axes/Hide Axes: Shows or hides the axes of the plot.
- Contours/No contours: Displays contours (or not) on top of the three-dimensional plot.
| Date | Author | Description |
|---|---|---|
| 04/07/1995 | Ingolf Heinrichsen (MPIK) | First Version |
| 19/07/1996 | Martin Haas (MPIA) / Carlos Gabriel (ESA/SAI) | Update |