3.5) The PIA Astrophysical Applications
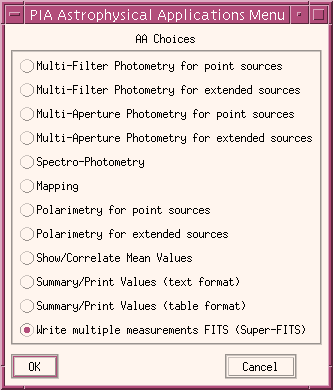
The Astrophysical Applications Window serves to enter the various follow up reductions beyond the AAP level. At this stage the processing steps are highly AOT specific, but the data could also be combined in a way not foreseen by the AOT design. In order to cope with this and to keep maximal flexibility PIA does not recognize the AOT type corresponding to the data, but offers diverse alternatives for their treatment.The main Astrophysical Applications window is a menu called via Buffers -> Astrophysical Work in the PIA Top Window.
This chapter describes the PIA Astrophysical Applications Window shown in Figure 1 and its items.

FIGURE 1: The PIA Astrophysical Applications Window
3.5.1) Applications using several measurements as input:
By all the Astrophysical Applications options, except by Spectro-Photometry and Mapping (on which the further reduction is performed on a per measurement basis), several measurements are chosen to be combined. The desired measurements will be selected using the by-now familiar measurement selection window, as for plotting and reducing data at the various stages of reduction.
From every measurement several variables are calculated yielding a value
per variable per measurement.
The main calculated variables are flux and surface brightness per measurement,
accompanied by filter, aperture, polarizer, etc. In the case of a C100
/ C200 measurement, fluxes are obtained by integrating over the full array
and surface brightnesses are obtained by averaging over the array.
In the case of C100 or C200 measurements, a choice of detector pixels
to be used is given. The selected pixels are then taken to obtain full
fluxes and brightnesses from the array. Please note that at this stage
a PSF correction is first applied by data from these detectors.
 Also
the possibility of colour corrections is offered, by a menu with
several source spectrum alternatives: black-body spectrum (with a choice
of temperature of the BB), power-law spectrum (with a choice of its index)
and modified BB spectra with emissivity proportional to nu and nu squared.
If one of the colour corrections is chosen, the calculated factors from
folding source spectrum and filter curve correct the data. The factors
used are presented to the user in a text window.
FIGURE 1b: Colour correction widget
Multi-Filter Photometry (for point or extended sources)
This application is for several measurements with different filters. After the selection of the measurements a PIA_Xplot is displayed showing either fluxes or surface brightnesses (for point or extended sources respectively) versus wavelength. They are calculated as explained in chapter 5, Processing Algorithms. Fig. 2 shows such a plot, as a combination of P1, P2 and P3 data. In addition a text display/print window pops up, giving the results in table form.
FIGURE 2: Multi-filter plot
Multi-Aperture Photometry (for point or extended sources)
As in the Multi-Filter photometry, a selection of several measurements leads to PIA_Xplots with fluxes and surface brightnesses versus the corresponding apertures areas.
Spectro Photometry
The menu shown in Fig. 3 pops up. A PHT-S measurement on the AAP level has to be chosen first from the File -> Select measurement option to get information on the measurement and to activate all the other buttons. Flux and Surface brightness spectra per raster point and chopper plateau can be displayed/overplotted in a PIA_Xplot window (Plot option).
FIGURE 3: PIA Spectro-photometry main window
From the Process -> Fit spectrum option a menu for fitting combinations of several functions to the spectrum can be activated, shown in Fig. 4. This program is an adaptation for PIA from an original package kindly offered to us by the ISO-SWS instrument dedicated team. A description of this menu is given in the next section (3.5.2) PIA Spectrum Multi-Fit Facility.

- FIGURE 4: PIA multi-fitting package

- FIGURE 5: Fit results window
Mapping
This option is largely explained in section 3.6, PIA Mapping Software.
Polarimetry
As in the Multi-Filter photometry, a selection of several measurements lead to PIA_Xplots with fluxes and surface brightnesses versus the corresponding polarizer angles.
Show and Correlate Mean Values
A selection of several measurements leads to a Show Structures windows, containing several main variables per measurement, for plotting and correlating.
Summary and Print Values (text or table format)
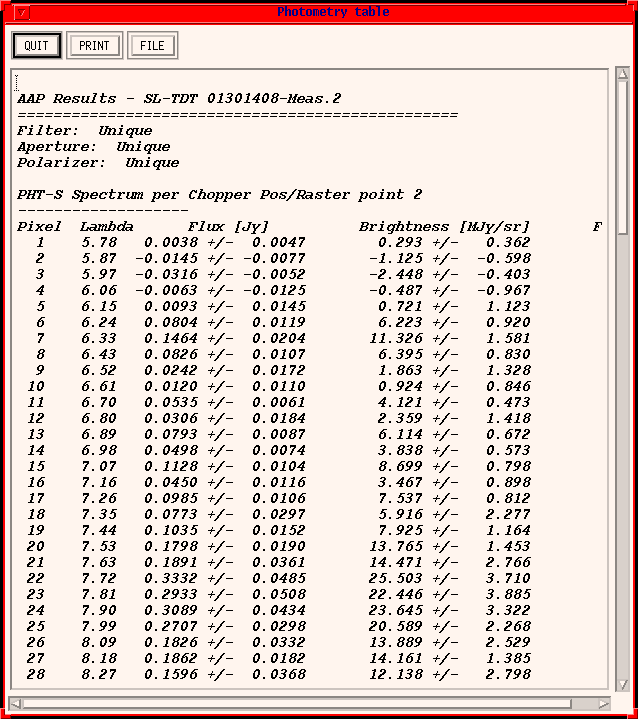
Through a selection of several measurements photometric lists are obtained, giving the main information per measurement and raster/chopper position of the measurements chosen. Figure 6 shows part of a list, containing information on a PHT-S measurement. If the version labelled as "Table format" is taken, the information is arranged in tabular form for their easy use of eg. a spreadsheet system.
FIGURE 6: Example of a Summary and Print Values list
Write multiple measurements FITS (Super-FITS)
This option produces a FITS file from one or multiple PHT-AAP measurements using the by-now familiar measurement selection window. The measurements can be of any type: PHT-C, PHT-P, and/or PHT-S. After the measurement selection is made, then the following Selection of elements window appears, FIGURE 7.
FIGURE 7: Selection GUI for the multiple FITS writing option.
At the top, the default filename is shown. Edit the directory and filename as necessary. The default name (for an example, May121659_AAP.FITS) contains the month, date, hour and minute respectively.The following variables can be selected or deselected to be contained in the FITS binary table.
- "Meas. ID (Det - TDT - Meas. number)" : All the selected measurements are consectively numbered for identification purpose within the FITS binary table. This variable which contains the detector, TDT, and measurement number information is written to the primary header with a keyword, "MEASID" followed by the corresponding number assigned to it. For example, the third measurement you selected will have "3" assigned to it, and you'll see its information next to the keyword "MEASID3" in the header.
- "Pixel number"
- "Aperture_Y in arcsec (zero means a circular aperture)"
- "Aperture_Z in arcsec (diameter if Aperture_Y is zero)"
- "Wavelength in um"
- "Uncertainty in wavelength in um" : In the cases of the PHT-C and PHT-P, the know values are given, and for PHT-S, it is half the difference between each pixel wavelength.
- "Mean flux in Jy" : This corresponds to MNFL in phtiaap structure.
- "Mean flux uncertainty in Jy" : This corresponds to MNFU in phtiaap structure.
- "Median flux in Jy" : This corresponds to MDFL in phtiaap structure.
- "Mean brightness in MJy/sr" : This corresponds to MNBR in phtiaap structure.
- "Mean brightness uncertainty in MJy/sr" : This corresponds to MNBU in phtiaap structure.
- "Median brightness in MJy/sr" : This corresponds to MDBR in phtiaap structure.
- "Raster point ID in Y"
- "Raster point ID in Z"
- "Declination in degrees"
- "Right Ascension in degrees"
- "Roll Angle in degrees"
- "Flag"
| Date | Author | Description |
|---|---|---|
| 20/07/1996 | Carlos Gabriel (ESA/VILSPA-SAI) | First Version |
| 06/06/1997 | Carlos Gabriel (ESA/VILSPA-SAI) | Update (V6.3) |
| 16/02/1998 | Carlos Gabriel (ESA/VILSPA-SAI) | Update (V7.0) |
| 20/08/1999 | Carlos Gabriel (ESA/VILSPA-SAI) | Update (V8.0) |
| 27/06/2000 | CG [input from Min Hur (IPAC)] | Update (V9.0) |