In reality, the situation for the SWS beam profiles is more complex than presented above in Section 8.3.1, which gives the impression that the SWS beam profile was the convolution of this rectangle with the telescope's point spread function. Within the SWS, the apertures are re-imaged twice. Vignetting and diffraction occur both at the focal-plane aperture and at an internal pupil image. These effects influence the beam profile in the dispersion direction: they make the profile narrower than what would be expected from the slit width. In the other dimension the beam profile is affected by geometrical imaging defects. Both these effects were observed in practice, while the instrument was in-orbit.
The profiles were indeed found to be slightly narrower than could be expected from the slit widths and the theoretical telescope beam. In bands 1 and 2 the cross-dispersion imaging defects produced profiles observed to be nearly triangular, rather than more or less rectangular. Cross-dispersion misalignment caused the beams from different detector arrays to be offset from each other. The narrower profiles, the poor cross-dispersion profiles at the short wavelengths and the detector misalignments all contributed to the sensitivity of SWS to pointing errors (see Section 8.6).
The beam profiles were fully characterised by observations consisting of
rectangular rasters, covering at least one diffraction beam outside the
slit, taken at fixed grating scanner positions corresponding to the
flux calibration key wavelengths. Target ![]() Boo was used for the
grating section and NML Cyg and
Boo was used for the
grating section and NML Cyg and ![]() Car for the FP section.
Car for the FP section.
The beam profiles depend on wavelength, clearly from band to band when either detector band or slit size change, but also in general within a band, due to the dependency of the diffraction profile on wavelength. For this purpose SWS01 maps were performed to determine the beam profile at all wavelengths.
The first exercise of this kind was performed early in revolution 126,
around ![]() Dra. This consisted in a series of 7 quick (speed 1) SWS01's
performed as a cross-like shape covering the size of the smallest SWS
aperture. However, a pointing offset became apparent as well as an
offset between detector bands which did not allow observations of both
sides of the profile.
Dra. This consisted in a series of 7 quick (speed 1) SWS01's
performed as a cross-like shape covering the size of the smallest SWS
aperture. However, a pointing offset became apparent as well as an
offset between detector bands which did not allow observations of both
sides of the profile.
A second and finer map was done on ![]() Boo later in revolution 244, but
the results showed some inconsistency. This was traced to the
brightness of
Boo later in revolution 244, but
the results showed some inconsistency. This was traced to the
brightness of ![]() Boo in the visible causing readout blooming effects on
the Star Tracker CCD when used at a time of the year when the
orientation of the Star Tracker was parallel to the line of sight
defined by
Boo in the visible causing readout blooming effects on
the Star Tracker CCD when used at a time of the year when the
orientation of the Star Tracker was parallel to the line of sight
defined by ![]() Boo and the guide star used.
Boo and the guide star used.
This type of exercise was then suspended, waiting for possible
improvement of the ISO pointing accuracy. Once achieved, three further
exercises were performed to characterise the small scale beam profile
close to the peak, via 5![]() 5 rasters done at 2
5 rasters done at 2
![]() steps on
steps on ![]() Boo (revolution 640) and NML Cyg (revolution 742) for the
grating and FP sections respectively. A third exercise was done on
Boo (revolution 640) and NML Cyg (revolution 742) for the
grating and FP sections respectively. A third exercise was done on
![]() Tau in revolution 860, for visibility reasons, to characterise on a
fine scale the full wavelength dependency in the Z direction covering
both sides of the profile.
Tau in revolution 860, for visibility reasons, to characterise on a
fine scale the full wavelength dependency in the Z direction covering
both sides of the profile.
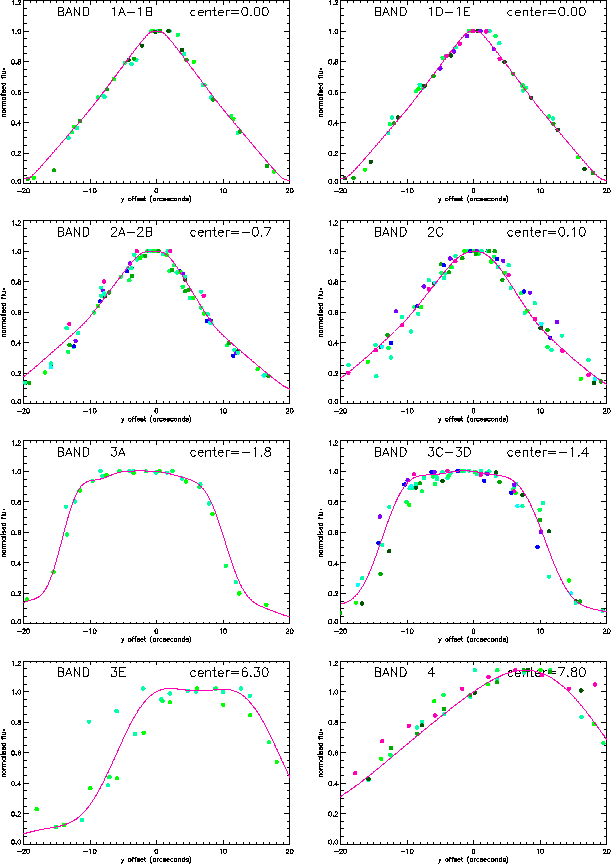
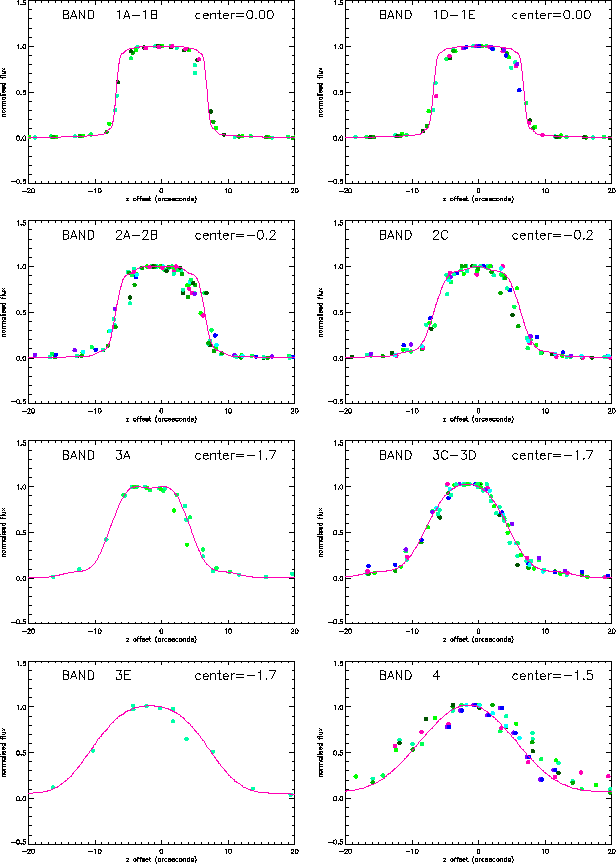
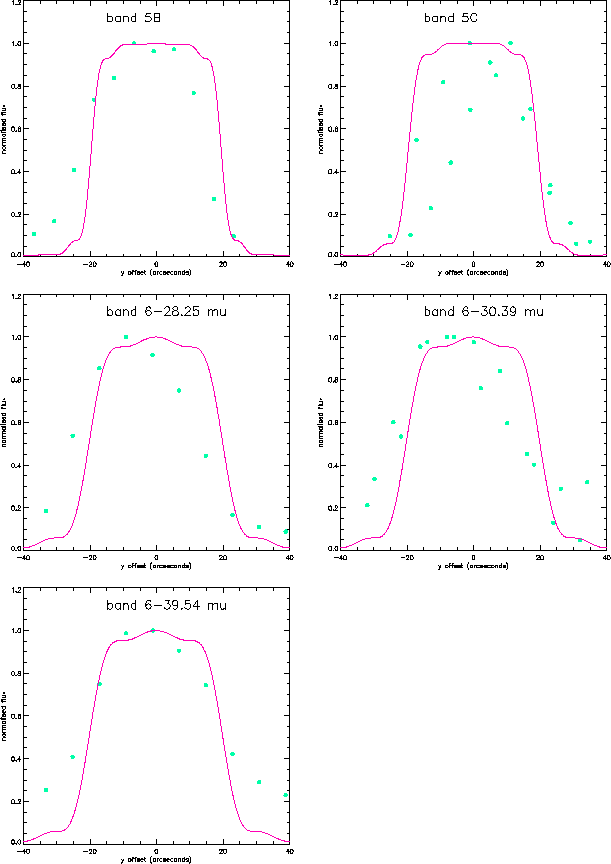
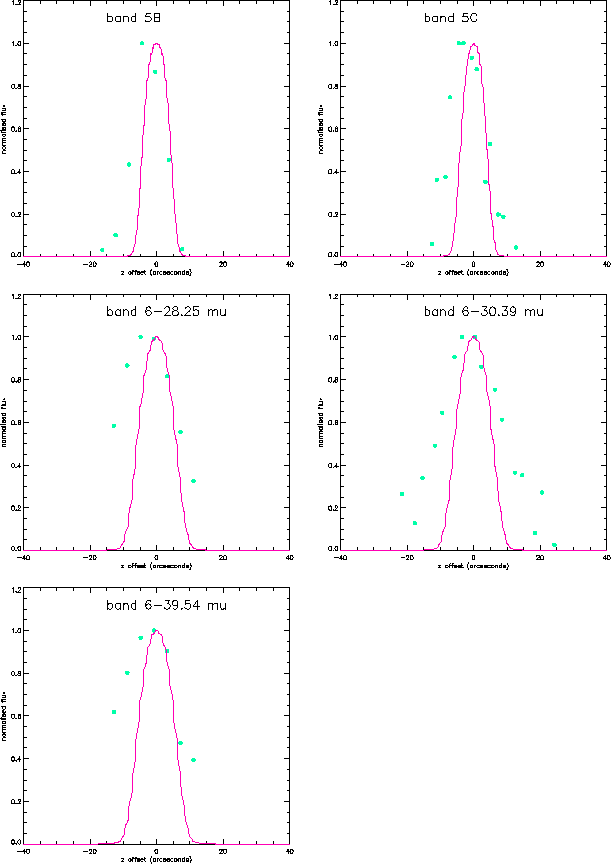
Beam profiles for all bands are given in Salama et al. 2001, [33]. Figures 8.1 to 8.4 present the results of the observations, together with the results from the SWS diffraction model. The diffraction model contains a blur model to reproduce the observed cross-dispersion profiles. The presented data are contained in the calibration files Cal-G 35_xx and Cal-G 36_xx. Note that except for the FPs all models and all observations represent the responses to extended sources. The exceptions are the model profiles of the FP, which were computed for a point source. The observed FP profiles are consistent with an FP fringe pattern across the slit.
|
|
|
|
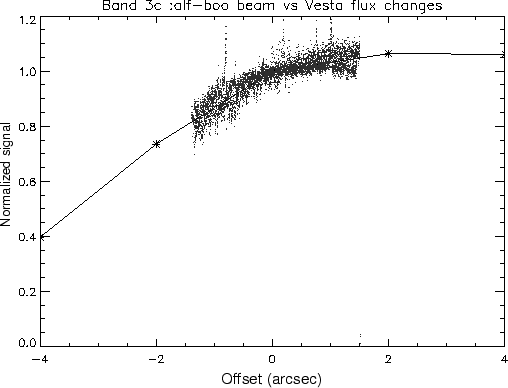
ISO tracked Solar System Objects (SSO) by means of successive linear rasters.
The raster parameters were computed by the mission planning software so
that on each raster leg the SSO was allowed to drift from
![]() 1
1
![]() to
to ![]() 1
1
![]() (prior to the pointing
improvement in revolution 290, the tracking was between
0
(prior to the pointing
improvement in revolution 290, the tracking was between
0
![]() and 2
and 2
![]() ). Dedicated measurements were
performed in revolution 769 to characterise the beam profile on the
subarsecond level, by letting the asteroid Vesta drift within the SWS
aperture. The correlation between this experiment and the earlier results
is shown in Figure 8.5. See Vandenbussche 1998,
[39], for more details.
). Dedicated measurements were
performed in revolution 769 to characterise the beam profile on the
subarsecond level, by letting the asteroid Vesta drift within the SWS
aperture. The correlation between this experiment and the earlier results
is shown in Figure 8.5. See Vandenbussche 1998,
[39], for more details.
|
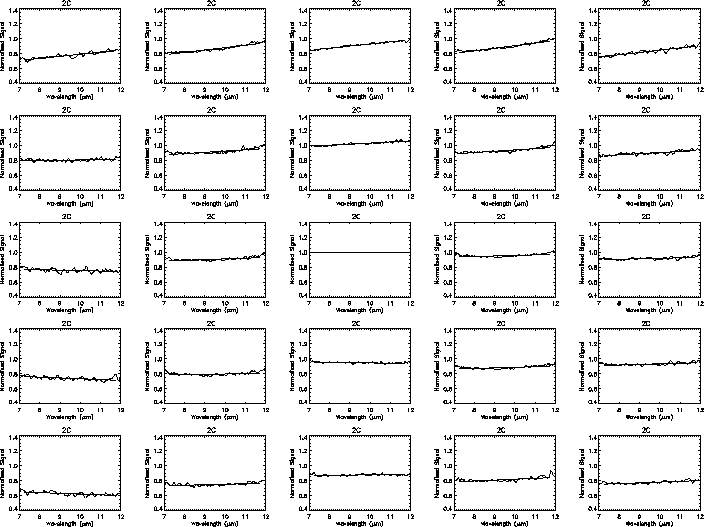
The SWS01 exercises were used for the characterisation of the beam profile wavelength dependence within a band, done by fitting a first order polynomial to the flux as a function of wavelength.
Only band 2C showed a dependence of the fit parameters on the offset from the
target (![]() Boo, or NML Cyg, shown in Figure 8.6). This
is unlikely to be caused by memory effects, as the down scan only has been
used in the reduction and also because the pattern is symmetric around the
target, but is more likely due to the large wavelength range covered by this
band.
Boo, or NML Cyg, shown in Figure 8.6). This
is unlikely to be caused by memory effects, as the down scan only has been
used in the reduction and also because the pattern is symmetric around the
target, but is more likely due to the large wavelength range covered by this
band.
|