In every post-helium revolution with SWS observations, a full spectrum of at
least
one calibration star was measured. Section 6.7
gives an overview of the calibration sources used for the flux calibration
(both relative and absolute) of the Post-Helium Phase.
Comparison of the observed calibration source spectra to a reference
spectral energy distribution (SED) shows an increasing tilt of the
observed spectrum as the temperatures increases.
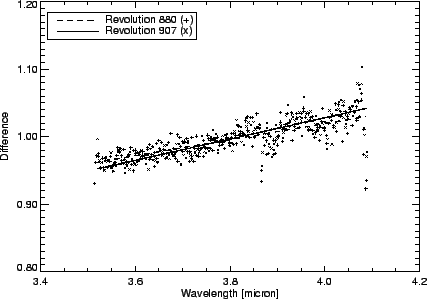
As can be seen in Figure 6.5, if the
spectrum of ![]() Dra observed in revolution 880 and
revolution 907 are divided by the model SED, the linear fit to the
residues shows a steeper slope in the later revolutions.
Dra observed in revolution 880 and
revolution 907 are divided by the model SED, the linear fit to the
residues shows a steeper slope in the later revolutions.

|
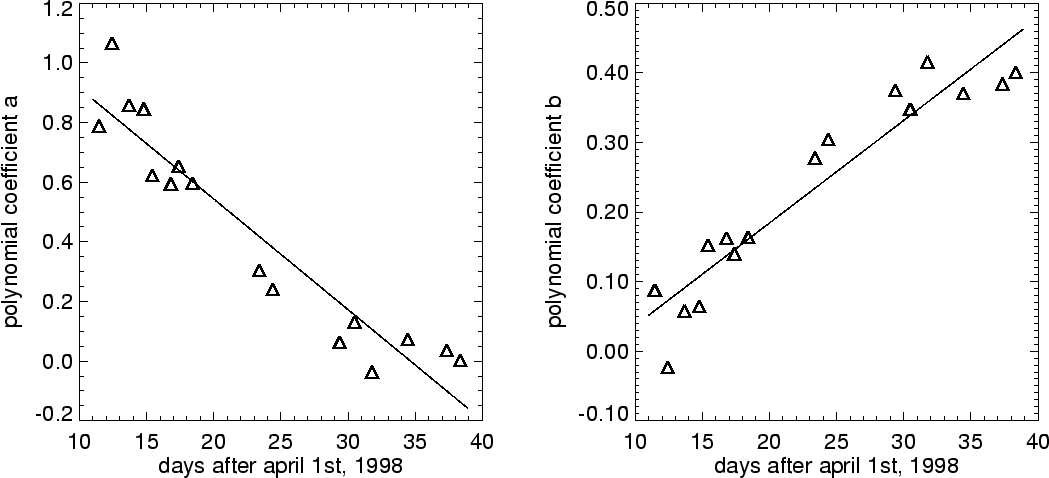
This effect was characterised for every spectral band by fitting a polynome
![]() (n=1) to the division of each calibration star spectrum by its
reference SED. The change of the coefficients of these fits in time was
then characterised by fitting 2 polynomes
(n=1) to the division of each calibration star spectrum by its
reference SED. The change of the coefficients of these fits in time was
then characterised by fitting 2 polynomes ![]() to the coefficients of
the polynomes
to the coefficients of
the polynomes
![]() . The tilt to apply on a spectrum observed
at time t is then
. The tilt to apply on a spectrum observed
at time t is then
![]() .
Figure 6.6 shows the coefficients of the
fits to the RFRF residues and the fits to the change of these coefficients.
.
Figure 6.6 shows the coefficients of the
fits to the RFRF residues and the fits to the change of these coefficients.

|
The characterisation described above minimizes the risk of biasing the correcting tilt to a noisy observation or a specific spectral feature not accurately represented in the synthetic spectra. The different calibration stars cover a wide range in spectral types. The deficiencies in the synthetic spectra are of a different nature and in different spectral regions (Section 6.7, Decin 2000, [4], Decin et al. 2000, [5]). The double fitting process described above results in some sort of 'averaging out' of the uncertainties in the synthetic spectra and the observations.