|
The calibration of any source is achieved by dividing the observed photocurrents for that source by the Relative Spectral Response Function (RSRF) i.e. the overall responsivity of the instrument for each detector, in terms of current per unit flux-density (Section 5.2.2). Clearly, any spurious features in the RSRF will be transferred to the calibrated spectrum. The signal-to-noise ratio obtained in the calibration observations of Uranus - and therefore in deriving the RSRF - is comparatively modest and thereby limits the signal-to-noise ratio on the calibrated spectrum of any other source, no matter how strong.
An eventual lack of precision in the Uranus model used to define the RSRF would also be propagated to all LWS observations, creating possible spurious features in the calibrated spectra.
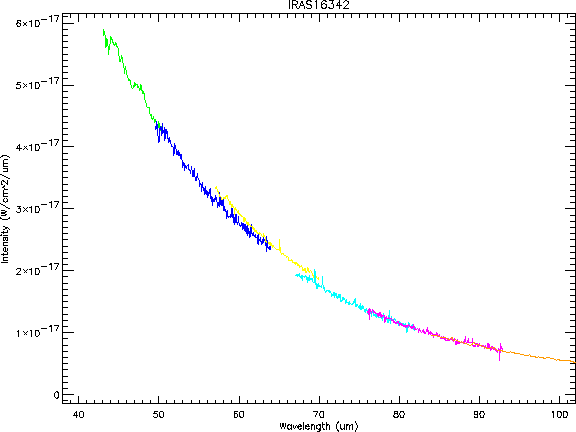
A good example of spectral features induced by uncertainties in the RSRF is a double-peaked profile visible in OLP Version 10 data products of all SW1 spectra of strong-continuum sources, as illustrated in Figure 6.4.

|
Therefore observers should be very circumspect in picking out unknown features in their spectra: these should be checked against the published RSRF (in the LCGR file). This can be done with the LWS Interactive Analysis software (LIA - see Section 8.2.3).