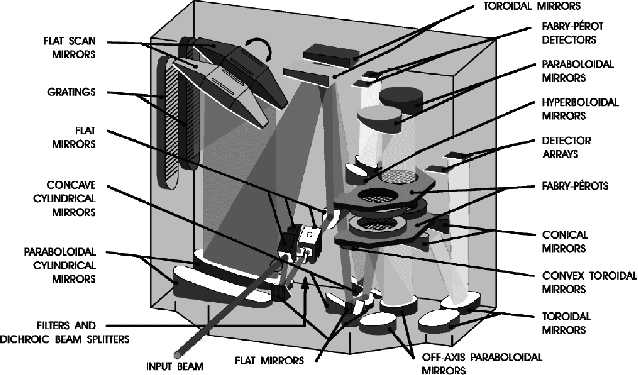
The Short Wavelength Spectrometer (SWS, see Figure
2.1) on board ESA's Infrared Space Observatory
(ISO) provided medium and high spectral resolution in the
wavelength region 2.38-45.2![]() m. Its two largely independent
grating spectrometers had a spectral resolution of
m. Its two largely independent
grating spectrometers had a spectral resolution of
![]() 1000-2000, corresponding to a velocity resolution of
1000-2000, corresponding to a velocity resolution of
![]() 150-300 km/s. By inserting Fabry-Pérot (FP) filters,
one for the range 15-26
150-300 km/s. By inserting Fabry-Pérot (FP) filters,
one for the range 15-26![]() m (with capability down to 11.4
m (with capability down to 11.4![]() m
at reduced resolution) and the other for the region 26-35
m
at reduced resolution) and the other for the region 26-35![]() m
(with capability to 44.5
m
(with capability to 44.5![]() m at reduced sensitivity), the
resolution could be increased to
m at reduced sensitivity), the
resolution could be increased to
![]() ,
,
![]() 10 km/s.
10 km/s.
The SWS wavelength range is of great scientific interest, not only because it is here that cool objects in the temperature range 80-1500 K radiate the bulk of their energy, but also because of its rich variety of atomic, ionic, molecular and solid-state spectral features. These provide unique and excellent tools for studies of the physical and chemical processes in the universe, especially of those regions optically hidden by interstellar dust. The SWS spectral resolution allows kinematic processes to be probed in a variety of objects ranging from nuclei of galaxies to planetary atmospheres. SWS made 3763 scientific observations during the lifetime of ISO, or 13% of the total number. These SWS observations lasted a total of 2694 hours, or 25% of the observing time of ISO. After helium depletion some 400 additional observations were done with SWS band 1 only. See Chapter 6.
Astronomers observed with ISO using what were known as Astronomical Observation Templates (AOT). There were four science templates for SWS, each devoted to a different sort of observation. Users filled in a template with the expected fluxes of their target, the wavelength range or lines they wanted to observe etc, and the logic that ran behind the template generated the necessary instrumental parameters and commands. There was one AOT to observe the entire SWS spectral range at low resolution (SWS01), another was for observing specific spectral lines (SWS02), a third to observe spectral ranges (SWS06), and a final one to observe targets using the FP (SWS07). As well as these four AOTs, a more flexible system was designed for calibration, the Calibration Uplink System (CUS). The CUS was not normally used by observers. The AOTs are discussed in detail in Chapter 3.
Data obtained by SWS was telemetered down by the satellite and collected at the ground station. For each observation several data files were generated containing raw data, instrument status, pointing information etc. The file containing the detector readouts in time order, was called the Edited Raw Data (ERD) file, edited because it was a reordered subset of the telemetry stream sent down from the satellite. The raw data was processed by an automatic pipeline to two further reduction levels. The first stage is known as Standard Processed Data (SPD). It contains the uncalibrated signal and pertaining wavelengths, still in time order. The second stage is called Auto-Analysis Results (AAR). Data at the AAR level has been processed to a level where it can normally be used for scientific analysis (flux versus wavelength), although further processing with interactive tools, like OSIA, generally improve the quality.