next up previous contents index
Next: 6.16 Responsivity Drift in Up: 6. Caveats and Unexpected Previous: 6.14 Use of `Non-prime


6.15 Side Order Contamination in FP Data

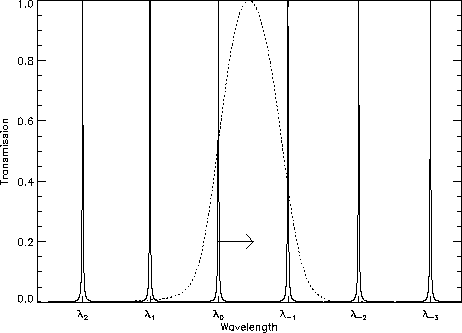
When the FP orders are so close together that more than one order is included in the range of wavelengths transmitted by the grating, the photocurrent recorded is an over-estimate of the true value. This is a particular problem on detector LW1 using the long wavelength FP (FPL) and SW2 using the short wavelength FP (FPS).

Therefore a correction to compensate for FP side order contamination is automatically applied in the LIA routine FP_PROC.

Figure 6.16: FP transmission for orders at wavelengths from $\lambda _{2}$ to $\lambda _{-3}$. The order at $\lambda_{0}$ moves across the grating spectral response profile (dotted line) creating one mini-scan. The photocurrent recorded at each point in this mini-scan also has a contribution from the adjacent order at $\lambda_{-1}$.
\resizebox {!}{8cm}{\includegraphics{order_contam_fig.ps}}

If more than one FP order occurred within the wavelength range transmitted by the grating the measured photocurrent was due to the combined flux in these orders (see Figure 6.16). If the FP throughput, detector response and intrinsic source flux did not change significantly between one FP order and the next then the relative contribution from each order can be calculated from the value of the grating transmission at each order wavelength.

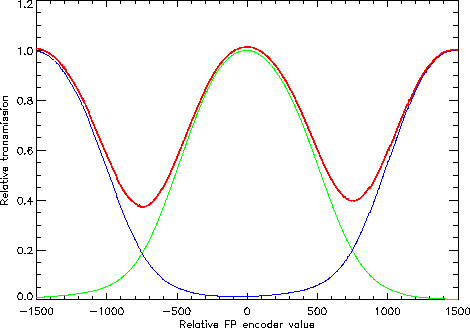
This is (automatically) carried out in a routine in FP_PROC that modifies the shape of the profile that is removed from the data. This is done individually for each mini-scan based on the separation of FP orders during that scan. Figure 6.17 shows an example of the extra transmission due to adjacent FP orders at each point on the grating profile. The corrected profile compensates for the transmission in the side orders.

Figure 6.17: Grating profile shown in green with the contribution from the two FP orders either side shown in blue. The combined profile in red compensates for the flux from the side orders.
\resizebox {!}{8cm}{\includegraphics{polehamptone5.eps}}

The correction works well for the general continuum level where the source spectrum was relatively flat over several FP orders. However, when an adjacent FP order occurred at the wavelength of a strong line, it can result in a false line detection. This is separated from the real line by the distance between FP orders. These are known as `ghost' lines and are not corrected for.


next up previous contents index
Next: 6.16 Responsivity Drift in Up: 6. Caveats and Unexpected Previous: 6.14 Use of `Non-prime
ISO Handbook Volume III (LWS), Version 2.1, SAI/1999-057/Dc