

Next: 5.4 Dark Current Determination
Up: 5. Calibration and Performance
Previous: 5.2 Absolute Flux Calibration
5.3 Fabry-Pérot Flux Calibration
The flux calibration in Fabry-Pérot mode is more complex than
for the grating.
Ideally the relationship between photocurrent and flux for the Fabry-Pérots
would have been directly established using observations of sources with
known spectral characteristics. However, the transmission of the
Fabry-Pérots is such that only the very brightest objects (Jupiter and
Saturn) would have
made suitable candidates for such observations. These have relatively
poorly known far-infrared spectra and, even with sources as bright as these,
the observations would have been prohibitively long. Therefore a boot strap
method is used whereby the photocurrent is first converted to flux using the
grating mode relationship and the signals from the illuminator operations;
this also removes the signature of the instrument RSRF in grating mode.
From OLP Version 8
onwards, a `throughput correction' is applied, thereby giving
the FP flux in units of W cm
 m
m . The throughput
correction is the FP transmission multiplied by the FP resolution
element,
the two factors being undissociable in
continuum observations; this has been derived using Mars as the
calibrator.
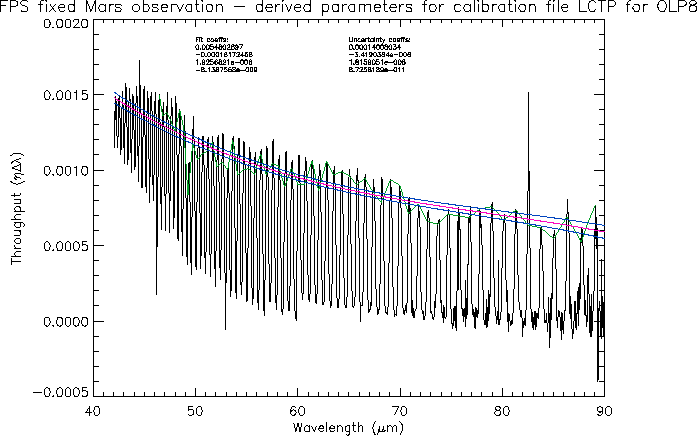
The Fabry-Pérot photometric calibration is derived from observations of Mars
made with the FPs set at a fixed gap and the grating scanned over its full
range. In this observation mode the various order and wavelength
combinations of the FP are selected as the wavelength falling onto the
detectors changes due to the grating movement. An example of the output
data are shown in Figure 5.3.
The peaks of the orders represent the
convolution of the instrument relative spectral response (RSRF), the
spectrum of Mars and the product of the transmission efficiency
 and effective
spectral element width
  of the FP used.
Figure 5.3:
Derivation of the FPS throughput with Mars
`mixed-mode' observations. Red line: Third order polynomial
fit to the peaks. Blue lines:
 .
.
|
|
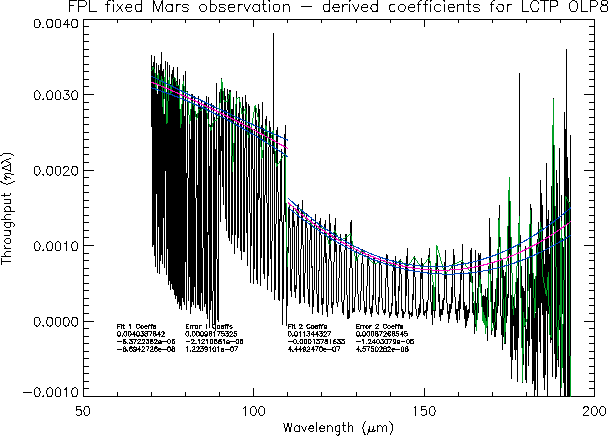
Figure 5.4:
Derivation of the FPL throughput with Mars
`mixed-mode' observations. Note the break around  m
between LW1 and LW2. Red line: Second order polynomial
fit to the peaks. Blue lines:
 .
.
|
|
With knowledge of the
instrument spectral response from grating measurements and a model of the
Martian spectrum the instrument and input spectrum
can be removed giving the FP  function versus wavelength which
can be deduced
by fitting the peaks with a low order polynomial (see
Figure 5.3). In the
case of the FPS this is a straightforward fit and there is no dependence on
detector or grating order. For the FPL the situation is more complex as
there is an apparent break between the detectors up to and including LW1 and
from LW2 through LW5 (see Figure 5.4).
This break has no explanation at
present, but it is clearly present for all FPL observations and the derived
calibration coefficients do correct for it.
The derived coefficients of
 for FPS and the two
sections of
FPL (SW4-LW1 and LW2-LW5) are stored in the calibration file LCTP
and used in
Auto-Analysis to correct all FP data to W cm
 m
m .
.


Next: 5.4 Dark Current Determination
Up: 5. Calibration and Performance
Previous: 5.2 Absolute Flux Calibration
ISO Handbook Volume III (LWS), Version 2.1, SAI/1999-057/Dc

