

Next: A. Infrared Astronomy
Up: 7. The ISO Data
Previous: 7.9 Historical Aspects
The usage of the ISO Data Archive is constantly monitored. A snapshot of the
statistics at the time of writing is shown in Figures 7.5
to 7.9 (see also Salama 2002b,
[142] and Matagne 2002, [119]).
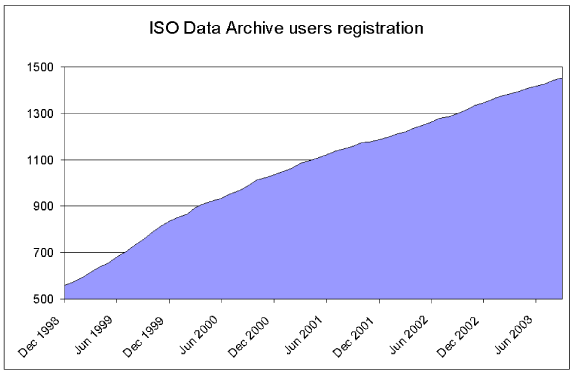
Figure 7.5:
ISO Data Archive users registration. At the time of its first release
in December 1998, all ISO proposers were pre-registered. New users are
continuously registering. During 2003 the registration rate was about 12 per month.
|
|
Figure 7.6:
ISO Data Archive users distribution by country
|
|
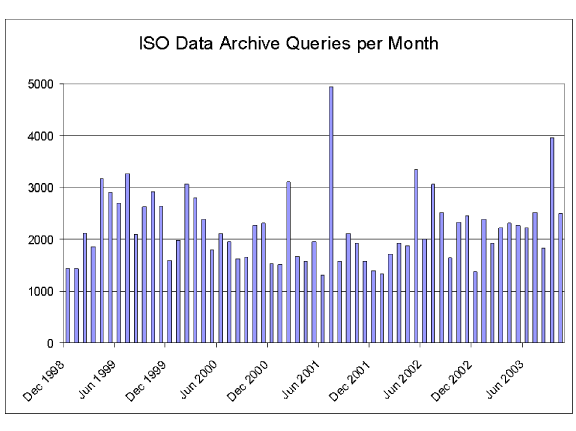
Figure 7.7:
ISO Data Archive queries per month. Users do not necessarily need to log in
to query the archive database. Only queries from external users are shown here.
|
|
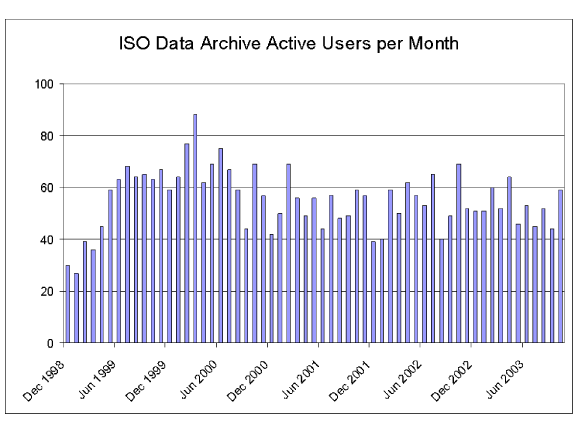
Figure 7.8:
ISO Data Archive active users per month. A user is here defined to be `active'
when a download of at least an observation dataset is performed in the given month.
Note that only users external from the ISO Data Centre and the National Data Centres are
considered here.
|
|
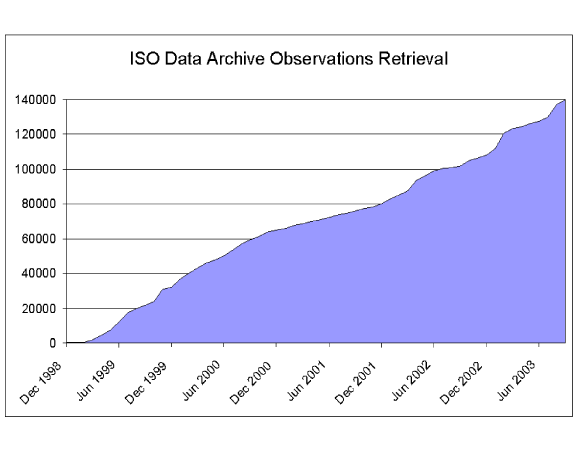
Figure 7.9:
ISO Data Archive observations retrieval. This plot shows the number of
observations downloaded by external users throughout the IDA lifetime. At the time of writing,
there has been a download of 4.7 times the equivalent of the scientific content of the archive
from the external astronomical community. This factor rises to 8.3, if
we also take into account users from the National Data Centres, working with the IDA for both
functional and visitor support activities.
|
|


Next: A. Infrared Astronomy
Up: 7. The ISO Data
Previous: 7.9 Historical Aspects
ISO Handbook Volume I (GEN), Version 2.0, SAI/2000-035/Dc


