A small sample of Hipparcos Input Catalogue (HIC, [83]) stars were used throughout the ISO mission to calibrate ISOCAM.
In order to determine the consistency between the measurements and the models used to derive the calibration curves, the fluxes derived from OLP Version 10 data for these stars obtained with multi-filter or CVF observations have been compared with the fluxes predicted by the models. Note that in many cases the same star was observed with various apertures. For this analysis all the available measurements were taken into account.
The fluxes considered here were those included in the CPSL (CAM Point Source List) file, which makes use of an automatic PSF fitting tool to determine the position and the flux of all the detected point sources in the ISOCAM field.
In general, the results obtained show that the consistency with models is within the 15% level in most cases.
However, it is remarkable that many of the flux measurements derived this way are significantly below the model fluxes. This could be the consequence of an incorrect PSF fitting since interactive aperture photometry with CIA generally overrides the problem.
The discrepancies between the mean value of all the measurements taken per
star and the corresponding model fluxes are listed in
Table 6.10. Globally considered, the
results obtained show that the fluxes listed in the CPSL files
are systematically ![]() 7% underestimated with respect to the model values.
7% underestimated with respect to the model values.
| Calibration star | OLP v10 |
| HIC 67485 | |
| HIC 69713 | |
| HIC 70218 | |
| HIC 73005 | |
| HIC 77277 | |
| HIC 85317 | |
| HIC 94376 | |
| HIC 94890 |
In Figures 6.31 and 6.32
we show two examples of the results obtained in the case of
HIC 67485 and HIC 77277, where the mean errors found were
![]() 2% and
2% and ![]() 10%, respectively.
10%, respectively.
The full report describing this consistency check can be found in Cesarsky 2002, [18].
![\resizebox {!}{5.7cm}{\includegraphics*[77,556][522,805]{hic67485olp10b9.ps}}](img257.gif)
|
![\resizebox {!}{5.7cm}{\includegraphics*[77,556][522,805]{hic77277olp10b9.ps}}](img258.gif)
|
Several checks were also made during the process of scientific validation of LWS OLP Version 10 data products against models of planets, asteroids and stars (Lim et al. 2001, [114]). A summary of the main results obtained are presented here:
LWS01 observations of Uranus
LWS photometric calibration is based on Uranus. Thus, a first consistency check was made by comparing Uranus observations versus the model produced by Griffin & Orton 1993, [64].
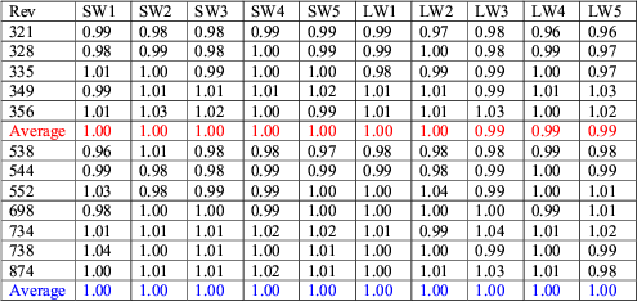
Table 6.11 shows the average flux for each detector and each observation divided by the average over the model for that detector. The red average row gives the overall average for the period of time covered by type 2 illuminator flashes (revolutions 237 to 442) and the blue row the period of time covered by the type 3 illuminator flashes (after revolution 442). Uranus was not visible during the period when type 1 illuminator flashes were used (before revolution 237).
After manual deglitching the available OLP Version 10 data products were averaged with a 2.5 ![]() clipping using ISAP Version 2.0. Detectors SW1 to SW5 were then smoothed with the nominal resolution element of 0.29
clipping using ISAP Version 2.0. Detectors SW1 to SW5 were then smoothed with the nominal resolution element of 0.29 ![]() m. LW1 to LW5 were smoothed with the nominal resolution of 0.6
m. LW1 to LW5 were smoothed with the nominal resolution of 0.6 ![]() m and both scans directions averaged.
m and both scans directions averaged.
Note that within the 15 measurements considered, the change in apparent
size of Uranus corresponds to a total flux variation of ![]() 10%, which
was included in the calculations. The background influence
is expected to be less than 0.5% and, therefore,
it was not taken into account.
10%, which
was included in the calculations. The background influence
is expected to be less than 0.5% and, therefore,
it was not taken into account.
The values obtained show that Uranus does calibrate back to the model and that the calibration is good and repeatable to within a few percent for all detectors.
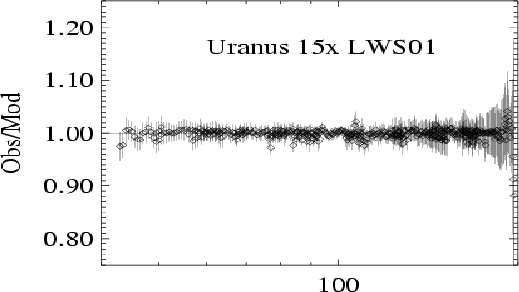
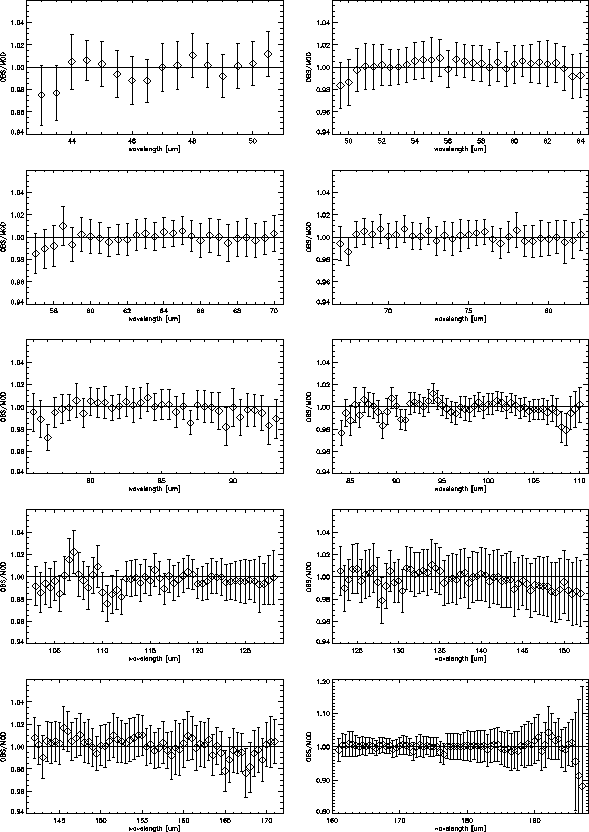
Looking into the behaviour of each detector more in detail, the same data set for which the results are shown in Table 6.11 were also used to produce Figures 6.33 and 6.34.
|
|
As we can see from the averaged observation/model ratios of all 15 measurements the agreement between Uranus model and the calibrated Uranus observations is in most cases within the 2% level. Only SW1 and SW2 show slightly larger deviations at the short wavelength end, as well as LW5, which shows a larger scatter at the long wavelength end.
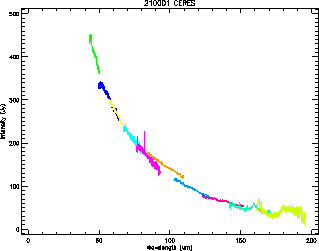
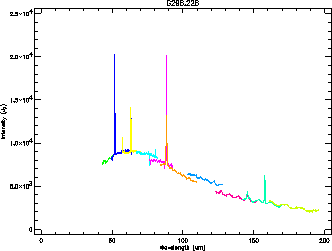
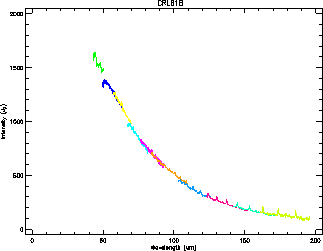
In general, the reasons for the deviations might be related to the different ways of calculating Uranus fluxes from the brightness temperature model. However, the fluctuations observed in the SW1 detector may be directly connected with a known problem in the RSRF, which produces a conspicuous double-peaked spectral shape observed not only in the spectrum of Uranus but also in all the astronomical sources inspected in the course of our cross-calibration analysis, including planets, asteroids and stars. The relative error induced by this deficient RSRF amounts to 5-10% in flux and its effect is clearly visible in most LWS spectra, as in the few examples plotted in Figure 6.35.
|
LWS02 observations of Uranus
Thirteen different observations of Uranus taken with the AOT LWS02 (fixed grating LWS spectra) were also retrieved from the ISO Data Archive (OLP Version 10 data products) and analysed in order to check the consistency of this observing mode of LWS.
Only the last 100 s of the detector signal were considered in order to avoid transient effects in the beginning of the measurements. After manual deglitching and dark current subraction using ISAP Version 2.0 (the background values were always smaller than 1% at all wavelengths) we derived the average flux per detector divided by the model.
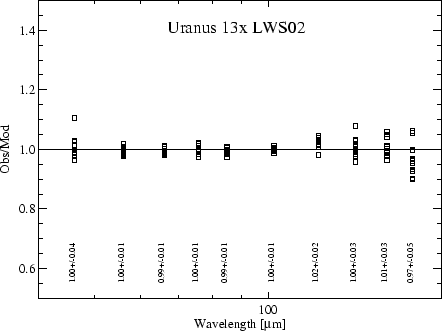
The agreement found in this case was within the 3% level in general. However, individual observations, especially in SW1 and in the long wavelength detectors LW3, LW4 and LW5 were sometimes off by up to 10% as we can see in Figure 6.36.
|
The average ratios per detector and their standard deviation are listed in Table 6.12.
| Detector | Detector | |||
| SW1 | 1.00 |
LW1 | 1.00 |
|
| SW2 | 1.00 |
LW2 | 1.02 |
|
| SW3 | 0.99 |
LW3 | 1.00 |
|
| SW4 | 1.00 |
LW4 | 1.01 |
|
| SW5 | 0.99 |
LW5 | 0.97 |
LWS observations of Neptune
Two LWS01 and thirteen LWS02 observations of Neptune retrieved from the ISO
Data Archive (OLP Version 10 data products) were analysed in a similar way.
The background values for Neptune were again taken from COBE/DIRBE weekly
maps (up to 100 ![]() m)
and yearly maps (for wavelengths larger than 100
m)
and yearly maps (for wavelengths larger than 100 ![]() m). The model of
Neptune adopted was developed by Orton & Burgdorf (private communication).
m). The model of
Neptune adopted was developed by Orton & Burgdorf (private communication).
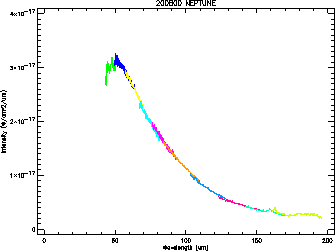
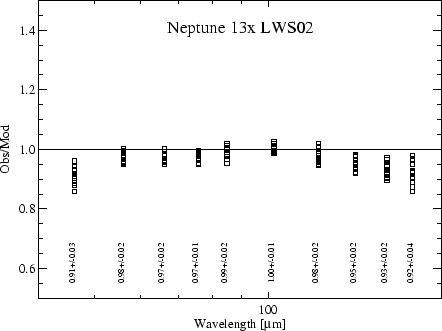
LWS01 and LWS02 observations of Neptune agree extremely well. In the full scans detector non-linearities appear as jumps between the individual detectors. In the LWS02 mode (see Figure 6.37), detectors SW2, SW3, SW4 and SW5 have been used as references since they seem to give consistent results for all objects. The other detectors are given relative to these 4 detectors. There is a nice agreement between the observations and model predictions but the model seems to underestimate the overall flux detected by 2%. SW1 is systematically 4-8% too low, LW1 a few percent too high. The stressed Ge:Ga detectors LW2 through LW5 are 5-10% too low, with increasing offsets at longer wavelengths. LW5 shows a larger scatter.
|
LWS observations of asteroids
The same exercise was performed on a number of asteroids.
OLP Version 10 data products were retrieved from the ISO Data Archive
and reduced using ISAP Version 2.0 in a similar way as Uranus and Neptune,
but here background
subtraction becomes quite important. The background values were taken
from COBE/DIRBE weekly maps (up to 100 ![]() m)
and yearly maps (for wavelengths larger than 100
m)
and yearly maps (for wavelengths larger than 100 ![]() m). The asteroid models
were those produced by Müller & Lagerros 2002,
[127].
m). The asteroid models
were those produced by Müller & Lagerros 2002,
[127].
LWS01 and LWS02 observations agree extremely well. The slight differences found between both observing modes are probably due to transients; LWS02 is less affected by transients since only the last 100 s of each fixed grating position were taken.
LWS01 observations of stars
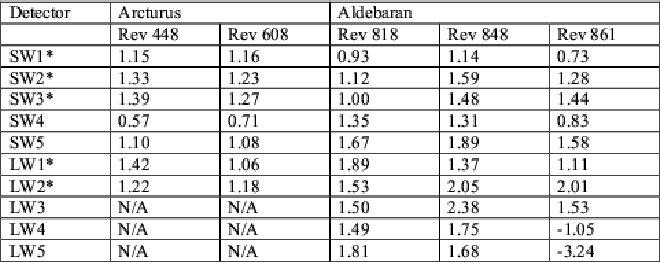
Stars are among the faintest objects observable with LWS and although detected, the uncertainty in the dark current was in many cases comparable to their flux, particularly at the longer wavelengths. Table 6.13 lists the average observations/model ratios per detector for two of the brightest stars observed with LWS01 as derived from OLP Version 10 data products. The stellar models were taken from the available templates in the Cohen, Walker, Witeborn et al. (CWW) absolute calibration programme (Cohen et al. 1992a, [28]; 1992b, [29]; 1995, [31]; 1996, [32] and 1998, [33]).
The scatter in the values obtained is mainly due to uncertainty in the dark current subtraction. Therefore, no definitive statement can be made about the detector performance, except that the photometric behaviour is still within pre-launch expectations of about 30-50%, even at these very low flux levels.
LWS02 observations of stars
Two LWS02 observations of ![]() Boo
(Arcturus) were also retrieved from the ISO Data Archive
(OLP Version 10 data products) and reduced
using ISAP Version 2.0. Background subtraction was again extremely important
in this case. The background values were taken
from COBE/DIRBE weekly maps (up to 100
Boo
(Arcturus) were also retrieved from the ISO Data Archive
(OLP Version 10 data products) and reduced
using ISAP Version 2.0. Background subtraction was again extremely important
in this case. The background values were taken
from COBE/DIRBE weekly maps (up to 100 ![]() m)
and yearly maps (for wavelengths larger than 100
m)
and yearly maps (for wavelengths larger than 100 ![]() m), as usual, and
they represent up to 50% of the total flux for some detectors.
The stellar model was taken from the CWW absolute calibration programme.
m), as usual, and
they represent up to 50% of the total flux for some detectors.
The stellar model was taken from the CWW absolute calibration programme.
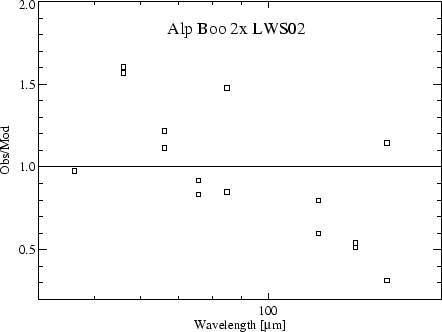
As we can see in Figure 6.39 detectors SW1, SW3 and SW4 agree within the 20% level with the model, while LW2 and LW3 are systematically too low (30 and 50%, respectively). Detectors SW2 and LW1 were affected by near infrared leak features.
|
Others stars like ![]() Dra were studied but, unfortunately,
they were too faint to perform any kind of analysis with the data products
provided by the pipeline.
Dra were studied but, unfortunately,
they were too faint to perform any kind of analysis with the data products
provided by the pipeline.
In summary, OLP Version 10 LWS data products of
Neptune, the few asteroids studied and ![]() Boo agree nicely with the
model predictions. Observational uncertainties are only large for the
fainter asteroids and for some of the stars studied, like
Boo agree nicely with the
model predictions. Observational uncertainties are only large for the
fainter asteroids and for some of the stars studied, like ![]() Tau or
Tau or
![]() Dra, mainly because they are also too faint for LWS.
Dra, mainly because they are also too faint for LWS.
Appart from the (known) problem affecting detector SW1 before revolution 237, which was corrected in Version 10.1 of the pipeline, detectors LW4 and LW5 usually encounter dark current problems. Manual dark current determinations improve the situation significantly; however, this is only an option for LIA users.
LW1, LW2 and LW3 show systematic effects assuming the COBE derived backgrounds. At the faint end the responsivities possibly depend on the total incoming flux. In the case of LW1 the calibrated fluxes can be up to 15% higher for the faintest sources (as compared to the models). For the stressed detectors LW2 and LW3 the opposite effect is found. Faint sources are systematically underestimated by up to 30% for LW2 and up to 40% for LW3.
A quick comparison with ISOPHOT stressed Ge:Ga detectors reveals the possible nature of this finding. An explanation for the discontinuities observed could come from the known non-linearities shown by stressed Ge:Ga detectors. When going from bright sources (Uranus) to faint sources (stars) the incoming fluxes change by three orders of magnitude. Non-linearity corrections over this flux range can be up to 50% for ISOPHOT. Similar effects could then be expected in LWS detectors.
Although the results are not conclusive,
empirical non-linearity corrections have tentatively
been derived for LW1, LW2 and LW3,
based on the sources here analysed (Neptune, the four asteroids and ![]() Boo). They are available in Müller 2001, [124].
Boo). They are available in Müller 2001, [124].
More details on these consistency checks can also be found in Müller & Lagerros 2001, [126].
In the case of PHT a large number of consistency checks with models of planets, asteroids and stars were also performed as part of the process of scientific validation of OLP data products (Klaas et al. 2000a, [100]; 2000b, [101]; Klaas & Richards 2002, [102]).
Some of the analysis made are summarised below.
PHT-S staring observations
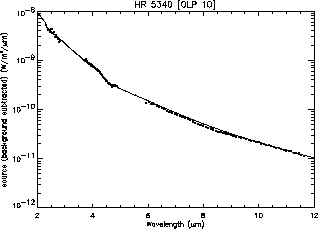
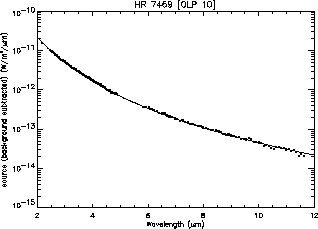
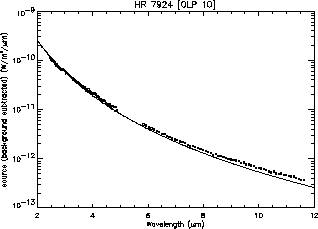
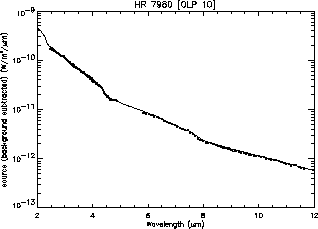
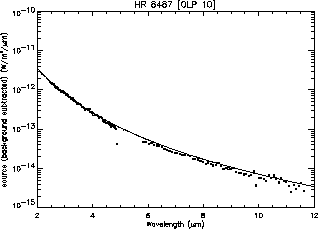
Staring PHT-S measurements of some of the calibration stars (HR7001 = Vega, HR 5340, HR 7469, HR 7924, HR 7980 and HR 8487) that were used to establish the dynamic relative spectral response function surfaces of Cal-G file PSDYNAMIC were checked in order to determine whether their input model SEDs were correctly reproduced by the pipeline.
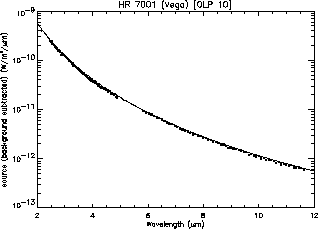
OLP Version 10 data products were retrieved from the ISO Data Archive. Once background subtracted, the SEDs of the stars above mentioned were compared with their flux models (see Figure 6.40).
The results obtained show that the absolute accuracy reached is better than
![]() 10% with a relative spectral shape accuracy better than
10% with a relative spectral shape accuracy better than ![]() 20% for
the flux range of 1-8000 Jy with the SS-array and for the
flux range of 0.2-1800 Jy with the SL-array.
20% for
the flux range of 1-8000 Jy with the SS-array and for the
flux range of 0.2-1800 Jy with the SL-array.
|
To confirm the accuracy of the observing mode the analysis was extended to a small number of non-calibration stars with similar spectral types as the standard stars above mentioned but different brightness, obtaining very similar results (Klaas & Richards 2002, [102]).
PHT-S chopped observations
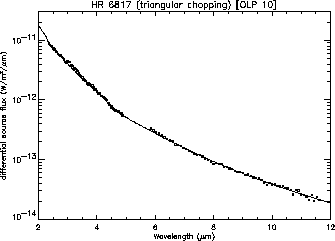
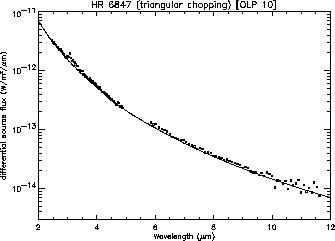
Measurements of two calibration stars (HR 6817 and HR 6847) which were used to establish the Relative Spectral Response Function for chopped PHT-S calibration were checked in order to determine whether their input model SEDs (provided by Hammersley et al. 1998, [72]) were correctly reproduced by the pipeline. Both calibration stars were measured both in rectangular and triangular chopped modes.
OLP Version 10 data products retrieved from the ISO Data Archive
show an excellent agreement with the models (see Figure
6.41). Although not shown in Figure
6.41 there is no significant difference in the
results between rectangular and triangular chopped mode. The absolute
accuracy and the relative spectral shape accuracy are in both cases
better than ![]() 10%.
10%.
|
As for the staring measurements, the analysis was extended to a small number of non-standard stars with different brightness, obtaining very similar results (Klaas & Richards 2002, [102]).
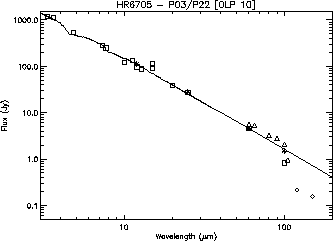
The composite spectra from 1 to 35 ![]() m extrapolated to 300
m extrapolated to 300 ![]() m
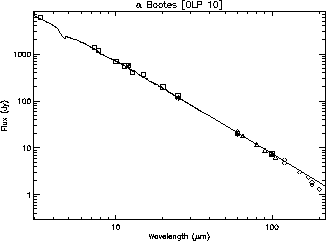
provided by Martin Cohen for HR 5340 (
m
provided by Martin Cohen for HR 5340 (![]() Bootes = Arcturus) and HR
6705 (
Bootes = Arcturus) and HR
6705 (![]() Draconis)
were compared with observations of these stars taken with PHT-P and PHT-C
in the staring modes PHT03 and PHT22 with all the available filters (except
the 3.6 and 4.85
Draconis)
were compared with observations of these stars taken with PHT-P and PHT-C
in the staring modes PHT03 and PHT22 with all the available filters (except
the 3.6 and 4.85 ![]() m filters in the case of HR 5340 because the source
saturated the detectors). The comparison plots are shown in Figure
6.42.
m filters in the case of HR 5340 because the source
saturated the detectors). The comparison plots are shown in Figure
6.42.
|
The conclusion obtained for HR 5340
is that OLP Version 10 photometry gives a good representation of
the SED from 3.3 to 170 ![]() m (agreement within 10% in most cases),
with still some problems at the longest wavelengths
where the source flux extraction is more difficult because of the strong
background.
m (agreement within 10% in most cases),
with still some problems at the longest wavelengths
where the source flux extraction is more difficult because of the strong
background.
In the case of HR 6705, there is a general good agreement from 3 to 100
![]() m with the only exception of a measurement at 15
m with the only exception of a measurement at 15 ![]() m affected
by strong transients. The C100 filters are systematically high by 20 to 45%.
Adopting a default responsivity calibration
for these filters gives fluxes which are lower than the model in contrast
with the fluxes derived from actual responsivity calibration. The
exception is the 105
m affected
by strong transients. The C100 filters are systematically high by 20 to 45%.
Adopting a default responsivity calibration
for these filters gives fluxes which are lower than the model in contrast
with the fluxes derived from actual responsivity calibration. The
exception is the 105 ![]() m filter which is too low both for actual and
default responsivity calibration methods. Very likely this is caused by
the background subtraction. For C200 filters, no useful results were
achieved. The fluxes are all too low or even negative.
m filter which is too low both for actual and
default responsivity calibration methods. Very likely this is caused by
the background subtraction. For C200 filters, no useful results were
achieved. The fluxes are all too low or even negative.
Similar analysis performed on other test cases indicate that reliable photometry with the standard on-off staring mode can be obtained up to a lower flux limit of 0.5 Jy for P1 and P2 detectors, 1.5 Jy for P3 and C100 detectors and 2.0 Jy for C200 with slightly worse accuracies in the case of chopped photometry, more affected by transients. Systematic offsets are only detected for some flux ranges in some filters for staring mode observations as well as for PHT-P photometry in smaller apertures than the standard ones (see Klaas & Richards 2002, [102] for more details).
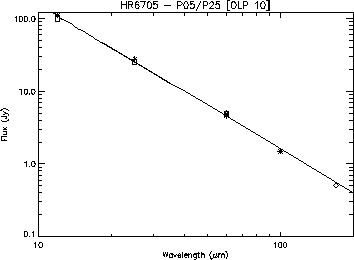
PHT05 and PHT25 (absolute photometry) measurements of
the calibration star HR 6705 (![]() Draconis)
were compared to the model available from Martin Cohen
(composite spectrum from 1 to 35
Draconis)
were compared to the model available from Martin Cohen
(composite spectrum from 1 to 35 ![]() m extrapolated to 300
m extrapolated to 300 ![]() m).
The background subtracted,
colour-corrected fluxes were compared also with IRAS photometry.
The results are shown in Figure 6.43.
m).
The background subtracted,
colour-corrected fluxes were compared also with IRAS photometry.
The results are shown in Figure 6.43.
|
The accuracy of the absolute photometry of ![]() Draconis is better than
Draconis is better than
![]() 15% for all detectors, even for the 170
15% for all detectors, even for the 170 ![]() m filter of C200 in
contrast to the multi-filter measurement.
m filter of C200 in
contrast to the multi-filter measurement.
A similar analyis was performed with a number of
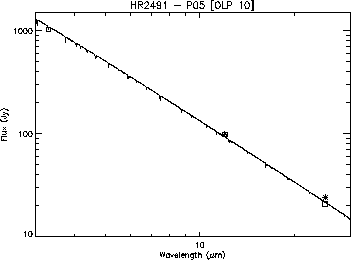
PHT05 observations of HR 2491 (Sirius)
covering the range from 3.3 to 25 ![]() m (see Figure
6.44). In this case
the accuracy of the absolute photometry achieved was
better than 6% for both P1 and P2 detectors
(for the 25
m (see Figure
6.44). In this case
the accuracy of the absolute photometry achieved was
better than 6% for both P1 and P2 detectors
(for the 25 ![]() m filter
a background measurement was performed and the non-negligible
background flux was subtracted from the on-target flux).
m filter
a background measurement was performed and the non-negligible
background flux was subtracted from the on-target flux).
|
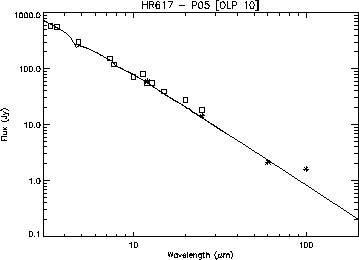
Similar results on absolute photometry (PHT05) were found when the
comparison was made using observations of
![]() Ari (HR 617) up to 100
Ari (HR 617) up to 100 ![]() m.
The background subtracted, colour-corrected flux
values derived from OLP Version 10.0 data products are shown in Figure
6.45.
m.
The background subtracted, colour-corrected flux
values derived from OLP Version 10.0 data products are shown in Figure
6.45.
Accuracies are found to be
better than 10% over the full P1 filter range, except
for the three filters centred at 4.8, 11.3 and 12.8 ![]() m.
The 4.8
m.
The 4.8 ![]() m filter colour correction appears to be not appropriate due to
an underlying strong absorption feature. For P2 detectors the
background subtraction was performed using COBE/DIRBE fluxes
since background measurements were not taken with ISOPHOT. Once this
background contribution is removed, the accuracy of the
P2 absolute photometry is also found to be better than 10%.
m filter colour correction appears to be not appropriate due to
an underlying strong absorption feature. For P2 detectors the
background subtraction was performed using COBE/DIRBE fluxes
since background measurements were not taken with ISOPHOT. Once this
background contribution is removed, the accuracy of the
P2 absolute photometry is also found to be better than 10%.
|
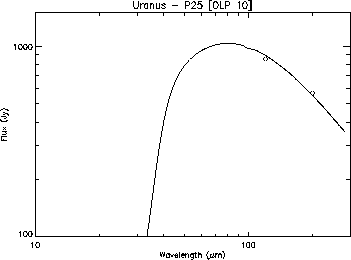
Finally, OLP Version 10 data products corresponding to C200 absolute
photometric mode (PHT25) observations of Uranus at 120 and 200 ![]() m
were also compared against the Uranus model produced by Griffin & Orton
1993, [64].
m
were also compared against the Uranus model produced by Griffin & Orton
1993, [64].
Figure 6.46 shows the results obtained where we can see that the measurements are within the 5% level of agreement.
|
Detailed cross-calibration comparisons were made by Decin 2001,
[40] between a few OLP Version 8.4 spectra of
bright stars observed with SWS and their corresponding synthetic spectra
from 2.38 to 12 ![]() m derived using the MARCS-code (Gustafsson et al. 1975,
[67] and subsequent updates).
m derived using the MARCS-code (Gustafsson et al. 1975,
[67] and subsequent updates).
The purpose of this study was to determine the origin of the small discrepancies detected between the ISO data and the theoretical spectra, leading both to improvements in the calibration of SWS and on the theoretical description of stellar atmospheres. This data set was used to improve the flux calibration of SWS bands 1 and 2 in OLP Version 10.
The broad-band shape of the relative spectral response function (RSRF) was as of OLP Version 8.4 already quite accurate in band 1. However, some improvements were made at the beginning of band 1A and a fringe pattern recognised at the end of band 1D was also corrected in OLP Version 10. The final accuracy of SWS in band 1 is estimated to be better than 2%.
In band 2 the calibration improved also with respect to previous calibrations in OLP Version 10, but still some problems exist. Due to the new model for memory effect correction based on the Fouks-Schubert model and developed by Do Kester (Kester 2001, [98]) the problems with the memory effects are now under control, at least when the flux jumps are not too high.
By making a comparison between the SWS data and the theoretical models first as a function of the spectral type and then as a function of the absolute flux value (see Figures 6.47 and 6.48) it was possible to distinguish between problems affecting OLP Version 8.4 which were spectral type related -i.e., problems with the theoretical predictions of the model - and problems which were flux, and so memory effect, related. This way it was learned that:
The majority of discrepancies encountered in bands 2B and 2C are due to still existing problems with the memory-effect correction and smaller problems with the RSRFs. This kind of exercise gives us, however, also an idea on the relative accuracy in band 2 for OLP Version 8.4: an accuracy of better than 6%, which is -- taking into account the problematic behaviour of the detectors in band 2 -- a very good result, which may have been slightly improved in OLP Version 10 with the latest iteration in the determination of the RSRFs.
|
|
The new set of synthetic spectra resulting from the work by Leen Decin
was used to improve the calibration of OLP Version 10, while in OLP
Version 8.4 models provided by Martin Cohen were used. Thus, a
confrontation between
the two sets may be instructive. Several stars are in common between the
two samples: i) Vega and Sirius, for which Cohen has constructed a
calibrated model spectrum; ii) a composite spectrum (i.e. various
observed spectra have been spliced to each other using photometric
data) is available for ![]() Cen A,
Cen A, ![]() Boo,
Boo, ![]() Dra,
Dra,
![]() Tau,
Tau, ![]() And,
And, ![]() Cet and
Cet and ![]() Peg; iii) a
template spectrum (i. e. a spectrum made by using photometric data of
the star itself and the shape of a `template' star) is built for
Peg; iii) a
template spectrum (i. e. a spectrum made by using photometric data of
the star itself and the shape of a `template' star) is built for
![]() Dra (template:
Dra (template: ![]() Gem: K0 III),
Gem: K0 III), ![]() Dra (template:
Dra (template:
![]() Boo: K2 IIIp),
Boo: K2 IIIp), ![]() Tuc (template:
Tuc (template: ![]() Hya:
K3 II-III) and HD 149447 (template:
Hya:
K3 II-III) and HD 149447 (template: ![]() Tau: K5 III). One should
notice that for the composite spectrum of
Tau: K5 III). One should
notice that for the composite spectrum of ![]() Dra, no
spectroscopic data were available at that time in the wavelength range from
1.2
Dra, no
spectroscopic data were available at that time in the wavelength range from
1.2![]() m till 5.5
m till 5.5![]() m. The spectrum of
m. The spectrum of ![]() Tau has
therefore been used to construct the composite spectrum of
Tau has
therefore been used to construct the composite spectrum of ![]() Dra in this wavelength range.
Dra in this wavelength range.
In order to
ensure independency of the absolute-flux level of the SWS data, the
angular diameters of the synthetic spectra were determined by using the
photometric data of Cohen, JKLM data from Hammersley's GBPP broad-band
photometry, IRAS data and some other
published photometric data cited in the IA_SED data-base. A comparison
between the (high-resolution) synthetic spectra, SEDs of Cohen and
used photometric data is given in Figure
6.49.
The obtained angular
diameters ![]() (in
(in ![]() ) for the stellar sources are
mentioned in the figure.
) for the stellar sources are
mentioned in the figure.
The
most remarkable discrepancies between the two spectra arise in the CO
and SiO molecular bands, where the molecular bands are consistently
across the sample stronger
in the composites of Cohen. Cohen used low-resolution NIR and KAO
data to construct this part of the spectrum. Comparing these synthetic
spectra with OLP Version 8.4 SWS data (whose calibration is not based on
our results) and the high-resolution Fourier Transform Spectrometer
(FTS) spectrum of ![]() Boo published by Hinkle et al. 1995,
[82] (see
Figure 4.5 in Decin 2000, [39]),
we did however see that the strongest, low-excitation, CO lines were
always predicted as being somewhat too strong (a few percent at
a resolution of 50000 for the FTS spectrum), probably caused by a
problem with the
temperature distribution in the outermost layers of the theoretical
model (Decin et al. 2003c, [44]).
Moreover, a comparison between
the high-resolution synthetic spectrum of
Boo published by Hinkle et al. 1995,
[82] (see
Figure 4.5 in Decin 2000, [39]),
we did however see that the strongest, low-excitation, CO lines were
always predicted as being somewhat too strong (a few percent at
a resolution of 50000 for the FTS spectrum), probably caused by a
problem with the
temperature distribution in the outermost layers of the theoretical
model (Decin et al. 2003c, [44]).
Moreover, a comparison between
the high-resolution synthetic spectrum of ![]() Boo with its
FTS spectrum shows also a good agreement for the high excitation CO
Boo with its
FTS spectrum shows also a good agreement for the high excitation CO
![]() lines, the low excitation lines being predicted as too
weak. The few percent disagreement between FTS and synthetic
spectrum will however never yield the kind of disagreement one
sees between the low resolution synthetic spectra and the SED
data. The CO
lines, the low excitation lines being predicted as too
weak. The few percent disagreement between FTS and synthetic
spectrum will however never yield the kind of disagreement one
sees between the low resolution synthetic spectra and the SED
data. The CO ![]() discrepancy visible in
discrepancy visible in ![]() Dra results
from using the
Dra results
from using the
![]() Tau observational KAO data. Since
Tau observational KAO data. Since ![]() Tau and
Tau and ![]() Dra have a different set of stellar parameters, with
Dra have a different set of stellar parameters, with ![]() Tau
having a significant larger amount of carbon, the SED of Cohen for
Tau
having a significant larger amount of carbon, the SED of Cohen for
![]() Dra displays too strong a CO feature. One should also be
heedful of this remark when judging upon the quality of the template
spectra for
Dra displays too strong a CO feature. One should also be
heedful of this remark when judging upon the quality of the template
spectra for ![]() Dra,
Dra, ![]() Dra,
Dra, ![]() Tuc and HD 149447.
Tuc and HD 149447.
As conclusion, we may say that the SED spectra of Cohen are excellent (and consistent) for the absolute calibration of an instrument, but that attention should be paid when using them for relative flux calibration.
This kind of analysis, which has been proven to be very adequate, will be applied also to bands 3 and 4 in the future.
|