The sample used for this internal cross-calibration comparison comprised around 100 different sources with both SWS (AOT SWS01) and PHT-S (AOT PHT40 either in staring or chopped mode) spectra available in IDA, showing a reasonable signal-to-noise ratio.
The OLP data products were compared in a systematic way since the end of the Post-Operations Phase with every new release of the pipeline. This resulted in the detection of several calibration problems affecting both PHT and SWS calibration that were conveniently reported in the corresponding (Cross)-Calibration Status Report.
As an example, one of the calibration problems discovered was
the effect of poorly modelled molecular features in the spectra of the
calibration stars used in the dynamic calibration of PHT-S, before it was
implemented in Version 9.0 of the pipeline. Based on the comparison of
OLP Version 7 SWS data and staring PHT-S observations of the asteroid
Hygiea with
the available thermophysical model it was possible to identify the residuals
left in the calibrated PHT-S spectra between 8 and 9 ![]() m by SiO
features not considered in the original models of the late type stars
taken as standards. Only excluding these stars from the generation of
the calibration files (and hence accepting a larger gap in the flux range
covered by the calibration standards) the spurious features were eliminated
in the calibrated spectra. After the correction was introduced in OLP
Version 9.0 the agreement between SWS01 and PHT-S staring observations
improved significantly.
m by SiO
features not considered in the original models of the late type stars
taken as standards. Only excluding these stars from the generation of
the calibration files (and hence accepting a larger gap in the flux range
covered by the calibration standards) the spurious features were eliminated
in the calibrated spectra. After the correction was introduced in OLP
Version 9.0 the agreement between SWS01 and PHT-S staring observations
improved significantly.
As of OLP Version 10, the level of agreement reached in terms of absolute flux between these two ISO instruments and observing modes was better than 10-15% for well-behaved data sets (bright, point-like sources not affected by any other known calibration problem). Moreover, the overall shape and even the faintest spectral features were also largely preserved from instrument to instrument (to within the few percent level in most cases) all over the spectral range covered by both instruments.
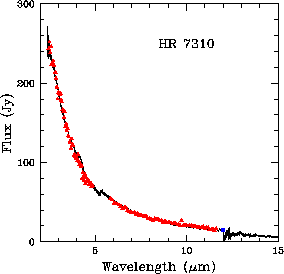
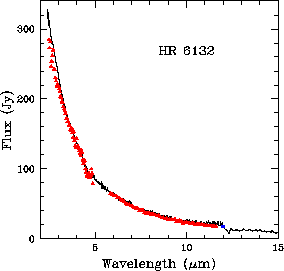
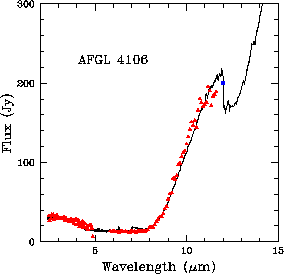
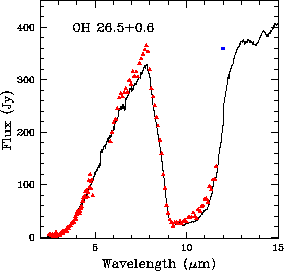
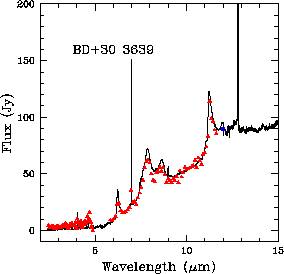
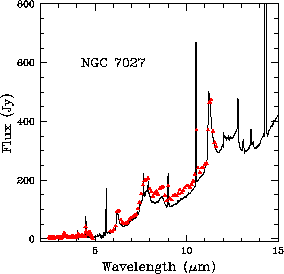
Figure 6.2 shows
some examples which illustrate the good agreement found over a wide
variety of sources with different spectral properties, all of them taken
from this cross-calibration sample. The plotted spectra are
OLP Version 10 data products directly retrieved from IDA
corresponding to representative cases of sources showing a `blue'
(HR 7310 and HR 6132) or `red' continuum (AFGL 4106 and OH 26.5+0.6), or
sources where strong PAH emission bands and/or nebular emision lines
(BD +30![]() 3639 and NGC 7027) appear overimposed on the infrared
continuum. A very good agreement between both instruments and the
IRAS photometry at 12
3639 and NGC 7027) appear overimposed on the infrared
continuum. A very good agreement between both instruments and the
IRAS photometry at 12 ![]() m (indicated with a blue square in the plots)
is also found.
m (indicated with a blue square in the plots)
is also found.
 |
 |
 |
 | '
 |
 |
The examples shown in Figure 6.2 correspond to relatively bright sources observed in all cases with PHT-S in staring mode. For the fainter sources the chopping mode of PHT-S was usually prefered and the behaviour of this mode was also investigated in terms of cross-calibration. The results obtained indicate a similar level of agreement with SWS (10-15%), in spite of the fact that the accuracy achievable with SWS at low flux levels is not expected to be as good.
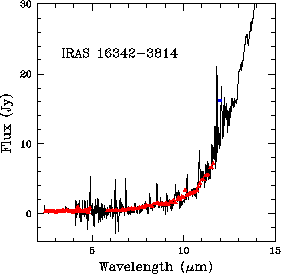
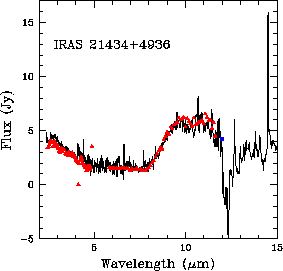
Figure 6.3 shows two faint sources (flux density
below 5-10 Jy)
observed with SWS and PHT-S. IRAS 16342![]() 3814 was observed with
PHT-S in staring mode while IRAS 21434+4936 was observed using triangular
chopping. We can see that a very nice agreement exists at absolute flux
level as well as in the shape of the individual SWS and
PHT-S spectra in both cases. Again, there is also a very good agreement with
the IRAS photometry at 12
3814 was observed with
PHT-S in staring mode while IRAS 21434+4936 was observed using triangular
chopping. We can see that a very nice agreement exists at absolute flux
level as well as in the shape of the individual SWS and
PHT-S spectra in both cases. Again, there is also a very good agreement with
the IRAS photometry at 12 ![]() m.
m.
Outside the overlapping spectral range, a significant jump
in flux is detected at the blue edge of
band 3A in the SWS spectrum of IRAS 21434+4936 at 12.0 ![]() m. This is
indicating an inaccurate dark current subtraction
by the automated pipeline (OLP Version 10). This kind of problem is
sometimes observed in the SWS spectra of faint sources
and needs to be manually corrected with the use of the SWS interactive
software analysis (OSIA) where the right dark current level
can be interactively chosen, eliminating the problem.
m. This is
indicating an inaccurate dark current subtraction
by the automated pipeline (OLP Version 10). This kind of problem is
sometimes observed in the SWS spectra of faint sources
and needs to be manually corrected with the use of the SWS interactive
software analysis (OSIA) where the right dark current level
can be interactively chosen, eliminating the problem.
 |
 |
A similar exercise was performed with a sample of around 20 sources identified in IDA to have SWS (AOT SWS01) and CAM-CVF (AOT CAM04) spectra available with a signal-to-noise ratio enough to be used for cross-calibration purposes.
Again, the OLP data products were compared in a systematic way since the end of the Post-Operations Phase with every new pipeline release since OLP Version 7.
In this case, the main improvement implemented in the pipeline since the start of this cross-calibration analysis was the application of transient corrections based on the Fouks-Schubert method (Fouks & Schubert 1995, [54]) both to SWS01 (band 2) and CAM04 data, which are described in detail in the corresponding instrument specific volumes of this Handbook.
As of OLP Version 10, the level of agreement between SWS01 and CAM04 spectra was in general within 10-15% down to the limits where dark current subtraction (especially for SWS) becomes a significant contribution to the error budget. This statement is valid over the whole spectral range covered by both instruments with the exception of the edges of CAM-CVF scans, which might be affected by transient effects even after the application of the Fouks-Schubert transient correction (this is especially true in the case of bright point sources, for which this correction simply does not work).
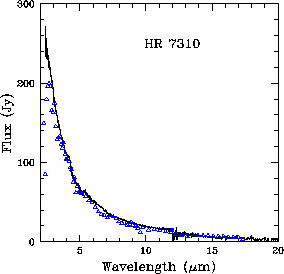
Figure 6.4 shows two examples where comparisons are made of CAM04 and SWS01 OLP Version 10 data products directly retrieved from IDA, taken from this cross-calibration sample. They correspond to the bright star HR 7310 (left panel) and to the fainter HD 179218 (right panel), which are representative of the general behaviour observed.
 |
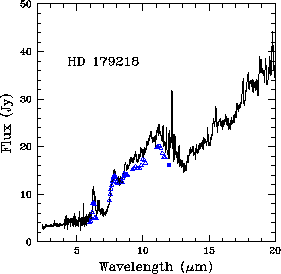 |
As we can see, the agreement is very good with the only exception of the blue edge of the CAM-CVF spectrum of HR 7310, affected by strong transient effects at the beginning of the measurement. This is, as we have already mentioned, a common feature observed in many cases in CAM-CVF spectra of bright sources and its strength depends on the illumination history conditions. It is well known that the Fouks-Schubert correction which is applied in the pipeline only works efficiently for very weak and/or extended sources (i.e. for low flux gradients) and has a neutral effect on bright point sources like HR 7310. Unfortunately, the problem cannot be corrected with the help of CIA.
Around 10 other sources were used for a similar internal cross-calibration comparison of CAM-CVF (AOT CAM04) and PHT-S (AOT PHT40 either in staring or chopping mode).
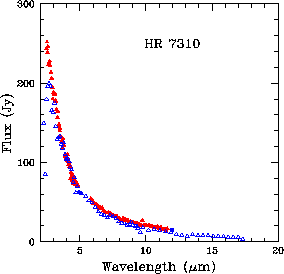
Figure 6.5 shows two examples where comparisons are made of CAM04 and PHT-S OLP Version 10 data products retrieved from IDA, taken from this small cross-calibration sample. They correspond to the bright star HR 7310 (left panel) and the faint HD 207129 (right panel), which are representative of the general behaviour observed.
 |
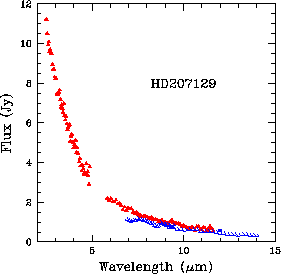 |
Note that for the faint star HD 207129, the background continuum emission
is not negligible. In this case, a background measurement available
in IDA taken at a position
3![]() away from the central source was used to subtract this
contribution. The spectrum shown in Figure 6.5 is the
result obtained after subtraction of this background.
away from the central source was used to subtract this
contribution. The spectrum shown in Figure 6.5 is the
result obtained after subtraction of this background.
We can see once more that a very good level of agreement exists
(within 10-15%) in the overall shape and
in the absolute flux level determined by the pipeline for CAM-CVF and PHT-S
spectra, as well as between the two instrument
observing modes and the IRAS photometry at 12 ![]() m.
m.
Again, the main problem is the strong discrepancy observed at the short end of the CAM-CVF spectra of both HR 7310 and HD 207129 induced, as we have already mentioned, by transient effects in the ISOCAM detectors.
In order to extend our internal cross-calibration analysis to longer
wavelengths we also checked the consistency of the absolute flux calibration
of SWS (AOT SWS01) and LWS (AOT LWS01) in the overlapping region of these
instruments. For this, a total number of 122 common pointings
(separated less than 2![]()
![]() )
were selected from IDA for which both SWS and LWS measurements were available
with fluxes between 43.7 and 44.4
)
were selected from IDA for which both SWS and LWS measurements were available
with fluxes between 43.7 and 44.4 ![]() m higher than 100 Jy.
m higher than 100 Jy.
Sources identified as variable in the literature in this cross-calibration sample were identified and removed from the sample except when the SWS and the LWS measurements were taken on the same revolution (usually one after the other as concatenated observations). Similarly, all sources reported to be extended were also discarded to avoid problems derived from the comparison of fluxes measured through different aperture sizes. In addition, a few other sources were excluded from the analysis because they were identified either as badly pointed (off-axis) or as sources with a possible (not previously reported) extended nature, according to the strong discontinuities observed between SWS bands (see Figure 6.1).
After this purge, the resulting sample still contains around 50 different
sources suitable for cross-calibration. A reduced subsample composed of
25 sources (used as test cases) were systematically
investigated every time there was a new release of the automated pipeline
since OLP Version 7. For each of them the average value of the observed
flux density ratio LWS/SWS at 44 ![]() m was determined using ISAP
(assuming that the source SED shape was of the
form
m was determined using ISAP
(assuming that the source SED shape was of the
form ![]()
![]() f
f![]() = constant, or equivalently
= constant, or equivalently ![]()
![]() f
f![]() = constant).
= constant).
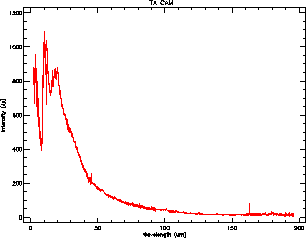
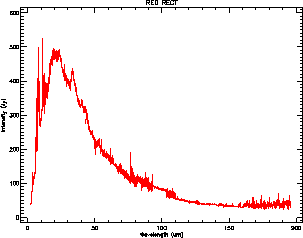
As it also happened in other cross-calibration analysis performed during Post-Operations, some calibration problems were identified during the course of this exercise. The most important one in this case was the detection of an anomalous behaviour of the SW1 detector in LWS in all the spectra taken before revolution 237. The flux of this detector appeared systematically underestimated (around 20%) with respect to both the adjacent SW2 detector of LWS and band 4 of SWS. The problem was identified as related to an incorrect treatment by the pipeline of the illuminator flash sequence used by LWS before this revolution and solved in OLP Version 10.1 by applying the necessary modifications in the automated calibration software.
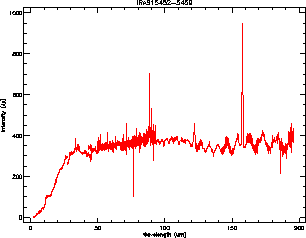
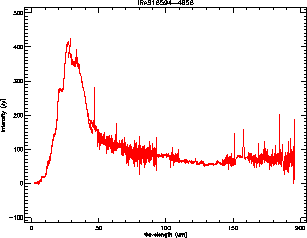
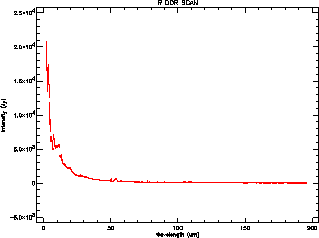
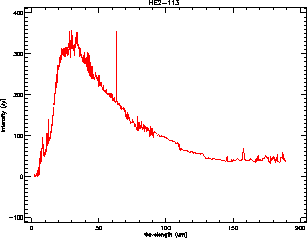
The results obtained as of OLP Version 10 for the 25 test cases above mentioned using ISAP Version 2.1 are listed in Table 6.1. Some examples of the corresponding composite SWS+LWS spectra are shown in Figure 6.6.
| Source | SWS TDT# | LWS TDT# | LWS/SWS | Notes |
| HD 161796 | 07100579 | 07100579 | 0.95 | |
| HD 101584 | 07901402 | 07901520 | 1.01 | |
| Hen 2 |
07903307 | 07903229 | 0.98 | |
| HD 161796 | 07100579 | 08001732 | 1.03 | |
| CPD |
27301339 | 08401538 | 1.03 | |
| IRAS 16342 |
45801328 | 08402827 | 0.94 | |
| Circinus | 07902231 | 10401133 | 1.26 | bad SWS band 4 |
| AFGL 4106 | 10401225 | 10401227 | 0.95 | |
| M 1 |
15901853 | 15901854 | 0.90 | |
| CW Leo | 19700159 | 19800158 | 1.11 | |
| 08001274 | 22002005 | 1.07 | ||
| SAO 34504 | 26302115 | 26300513 | 1.12 | bad SWS band 4 |
| IRAS 19114+0002 | 52000234 | 31900901 | 0.96 | |
| OH 26.5+0.6 | 33000525 | 33000316 | 1.01 | |
| VX Sgr | 09900171 | 33100802 | 1.04 | |
| IRAS 15452 |
45900615 | 48800916 | 1.12 | bad SWS band 4 |
| IRAS 16594 |
45800441 | 49001642 | 1.02 | |
| IRAS 19114+0002 | 52000234 | 52500861 | 1.00 | |
| R Dor | 58900918 | 59300644 | 1.03 | |
| Hen 2 |
07903307 | 60701891 | 1.07 | |
| CRL 618 | 68800561 | 68800450 | 0.90 | bad SWS band 4 |
| IC 418 | 82901301 | 68900805 | 1.04 | |
| TX Cam | 69501070 | 69501069 | 1.06 | |
| HD 44179 | 70201801 | 70201904 | 1.00 | |
| IC 418 | 82901301 | 86801205 | 1.03 |
If we exclude from the analysis four objects showing calibration
problems in band 4 of SWS (those presenting strong mismatches with band 3,
indicated in Table 6.1), we can see that the mean
LWS/SWS ratio derived from these measurements is ![]() LWS/SWS
LWS/SWS![]() = 1.01, very
close to unity, with a very little dispersion
around this value (in most cases the agreement is at the 10% level or
better). This is remarkable, if we consider that LWS and SWS were
calibrated in a totally different way (LWS calibration is
based on Uranus as primary calibrator while SWS band 4 calibration is
mainly based on the results of ground-based ILT experiments using
blackbody sources).
= 1.01, very
close to unity, with a very little dispersion
around this value (in most cases the agreement is at the 10% level or
better). This is remarkable, if we consider that LWS and SWS were
calibrated in a totally different way (LWS calibration is
based on Uranus as primary calibrator while SWS band 4 calibration is
mainly based on the results of ground-based ILT experiments using
blackbody sources).
As a byproduct of this analysis and since some of the objects in this cross-calibration sample were repeatedly observed throughout the mission with either SWS or LWS, it was also possible to perform an independent analysis of the stability of both instruments in terms of absolute flux calibration. The results obtained indicate that both for LWS and SWS the reproducibility was better than 15% in all cases.
|
An excellent agreement is also found when comparing ISOCAM
filter measurements with PHT-S spectroscopy. As an example of this, we
present here the results obtained from a cross-calibration comparison
performed at a very low flux level (a few mJy) of ISOCAM filter
photometry (AOT CAM01) and PHT-S spectroscopy (AOT PHT40)
of a sample of 55 Seyfert galaxies reported in Schulz et al. 2000,
[147]. Seyfert galaxies in the sample were observed
both with ISOCAM LW2 (6.7 ![]() m)
and LW7 (9.6
m)
and LW7 (9.6 ![]() m) filters and with chopped PHT-S photometry.
m) filters and with chopped PHT-S photometry.
In this case, however, the comparison is not based on OLP Version 10 data products. Instead, calibration was performed using standard CIA and PIA routines starting from ERD. Manual recalibration of the spectra included only glitch de-tailing and transient correction of the chopped PHT-S measurements in a similar way as the Version 10 of the automated pipeline does it. Thus, the expected level of agreement reached in the final products is very similar.
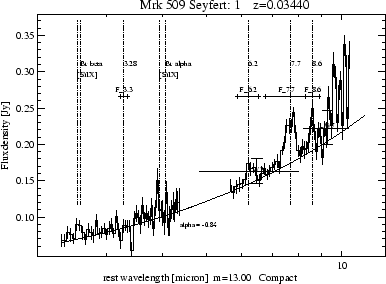
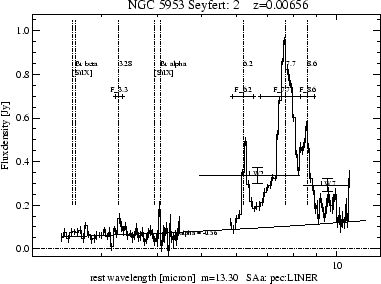
In Figure 6.7 we can see two nice examples of PHT-S and ISOCAM filter measurements of the Seyfert galaxies Markarian 509 (Seyfert 1) and NGC 5953 (Seyfert 2).
|
The results obtained are very satisfactory since the global median flux ratio (ISOCAM filter/PHT-S) derived from the measurements is: 1.15 for the LW2 measurements and 0.94 for LW7, i.e. ISOCAM flux densities without colour correction are only 15% higher in LW2 and 6% lower in LW7 than the corresponding PHT-S measurements.
The colour correction for the large bandpass-filter could explain the
difference for LW2 up to 10%, as the spectral energy distribution of
the Seyfert galaxies observed are red, and with the PAHs contribution in the
reddest part of the filter wavelength range. On the other hand,
the higher fluxes detected in the LW2 5-8.5 ![]() m filter might also
be contaminated by the contribution from the stellar content of the
underlying extended galaxy which
may still be detectable even for the almost point-like Seyferts, the ISOCAM
aperture being wider than the PHT-S one.
m filter might also
be contaminated by the contribution from the stellar content of the
underlying extended galaxy which
may still be detectable even for the almost point-like Seyferts, the ISOCAM
aperture being wider than the PHT-S one.
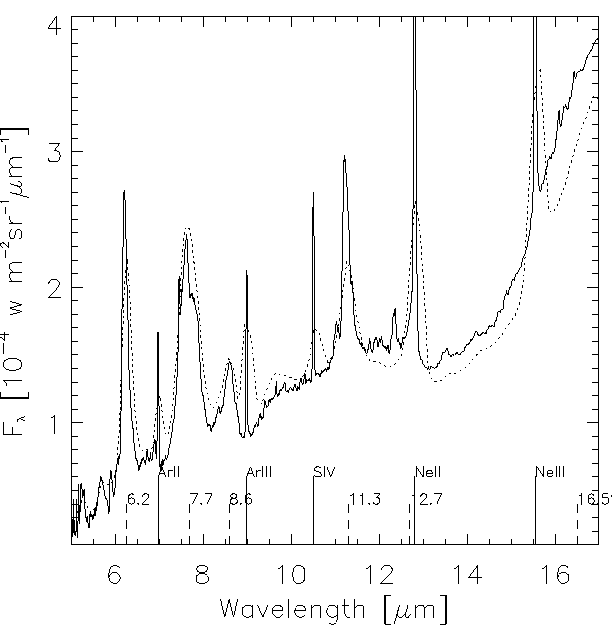
Observations of the Orion bar complex made with CAM-CVF and SWS
by Cesarsky et al. 2000, [19] are shown here as an
example of this cross-calibration analysis. The spectrum of this region of
the sky shows a combination of strong emission features
corresponding to PAHs and amorphous silicate grains together with
narrow emission lines coming from an ionised region around the isolated
O9.5 V star ![]() Ori A, as we can see in Figure
6.8.
Ori A, as we can see in Figure
6.8.
The simultaneous presence of broad and narrow emission features makes this comparison quite interesting for cross-calibration purposes since it constitutes an excellent laboratory to test the internal consistency of ISO calibration in the presence of emission lines.
|
The CAM-CVF observations employed the 6" per pixel field of view of ISOCAM.
Full scans of the two CVFs in the LW channel of the camera were
performed with both increasing and decreasing wavelength. The results of
these two scans are almost identical, showing that the transient response of
the detector was only a minor problem for these observations.
The raw data were processed using CIA in a standard way and the Fouks-Schubert
transient correction was applied to the data resulting in only minor
corrections. The CAM-CVF spectrum of ![]() Ori shown in Figure
6.8 was obtained co-adding all the pixels falling
within the SWS aperture.
Ori shown in Figure
6.8 was obtained co-adding all the pixels falling
within the SWS aperture.
The full range (2.4 to 46 ![]() m) SWS spectrum of the HII region
surrounding the star
m) SWS spectrum of the HII region
surrounding the star ![]() Ori A was
reduced with SIA using version 30 of the Cal-G files.
Ori A was
reduced with SIA using version 30 of the Cal-G files.
Since the interactive data reduction performed was done in a similar way as Version 10 of the pipeline does it both for ISOCAM and SWS data, the level of agreement reached is expected to be comparable to that obtained using OLP data products. And this was actually found to be excellent, within 20% both for the continuum and for the emission lines.
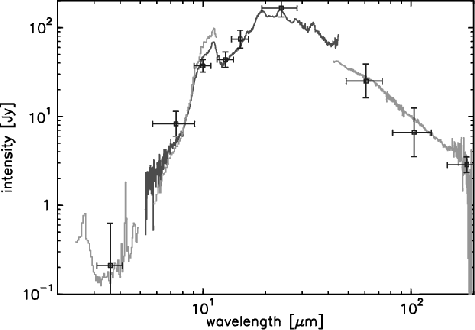
Observations of comet Hale-Bopp taken in October 1996 with ISOPHOT
using 4 different detectors (P1, P2, C100 and C200) and 10 filters
covering the range between 3.6 and 170 ![]() m by Grün et al. 2001,
[66] have been compared with
quasi-simultaneous observations taken with PHT-S (Crovisier et al.
1997, [37]), SWS (Crovisier et al. 2000,
[38]) and LWS (Lellouch et al. 1998,
[109]).
m by Grün et al. 2001,
[66] have been compared with
quasi-simultaneous observations taken with PHT-S (Crovisier et al.
1997, [37]), SWS (Crovisier et al. 2000,
[38]) and LWS (Lellouch et al. 1998,
[109]).
Figure 6.9, taken from Grün et al. 2001,
[66] shows the ISOPHOT photometric fluxes
together with the PHT-S, SWS and LWS spectra taken on 6-7 October 1996,
scaled to a 19![]()
![]() aperture. This required the application
of aperture correction factors which assumed a 1/
aperture. This required the application
of aperture correction factors which assumed a 1/![]() brightness
distribution, where
brightness
distribution, where ![]() is defined as the projected distance from the
nucleus. Details on the data reduction
of each dataset used in this cross-calibration comparison
can be found in the above referenced paper.
is defined as the projected distance from the
nucleus. Details on the data reduction
of each dataset used in this cross-calibration comparison
can be found in the above referenced paper.
|
In the case of the ISOPHOT filter measurements, background observations were performed with identical instrument settings at the same positions on the sky several days after the comet observations to subtract the contribution from the sky emission to the on-source photometric measurements. All observations were done in single pointing, single filter absolute photometric mode (PHT05 and PHT25).
A reasonable agreement was found between the independently calibrated photometry and spectroscopy in most cases in spite of the many different correction factors applied to the data. These correction factors are needed in the case of ISOPHOT to cope with the different apertures used per filter, positional offsets (observations where the source was not perfectly centred in the aperture), PSF effects on coma measurements, and the usual colour corrections. For SWS, additional scaling factors were applied to the different bands to make the spectrum continuous; these scaling factors were always close to one.
We present here the results obtained from the
cross-calibration analysis performed at the long wavelength
spectral range covered by ISO between 60 and 200 ![]() m using a
combination of PHT-C measurements and LWS01 observations.
m using a
combination of PHT-C measurements and LWS01 observations.
As it has already been mentioned before, this comparison is difficult because of the limited common dynamic range and the lack of astronomical sources observed both with PHT-C and LWS suitable for cross-calibration.
Searching the ISO Data Archive it is possible
to select around 200 different positions in the sky
where ISO observations were performed both with
PHT-C filters (photometry beyond 60 ![]() m) and LWS01, corresponding to about
100 different astronomical sources. However, there are very few of them
with both PHT and LWS observations of enough quality to derive reliable
numbers. In addition, the strong infrared background sometimes
completely dominates
the measurements especially at the longest wavelengths making
cross-comparisons more difficult.
m) and LWS01, corresponding to about
100 different astronomical sources. However, there are very few of them
with both PHT and LWS observations of enough quality to derive reliable
numbers. In addition, the strong infrared background sometimes
completely dominates
the measurements especially at the longest wavelengths making
cross-comparisons more difficult.
Moreover, we need to purge as usual this cross-calibration sample for bad-pointed observations, variable and extended sources, which at the end limits the number of suitable sources to just 9 common observations which are presented in Tables 6.2 and 6.3. These were the observations selected as test cases for this cross-calibration analysis.
For the derivation of the fluxes quoted in Tables 6.2 and 6.3 we retrieved
from the ISO Data Archive the OLP Version 10 PHT-C photometric data
together with the corresponding OLP Version 10 LWS spectra. In the case of
the PHT-C photometry
we just took directly the values provided by the automated pipeline while
the LWS spectra were further processed with ISAP Version 2.1 in
order to derive the equivalent `synthetic photometry' at 60, 100, 120, 150
and 200 ![]() m.
m.
For this we used the syn_phot
application in ISAP, which allows the
convolution of the ISO LWS spectrum with the
transmission profile of the different IRAS PHT-C filters used in the
comparison. The programme assigns a monochromatic flux at each of these
wavelengths as output
under the assumption that the source SED shape is of the
form ![]()
![]() f
f![]() = constant, or equivalently
= constant, or equivalently ![]()
![]() f
f![]() = constant, in the same way as PHT-C calibration
did.
= constant, in the same way as PHT-C calibration
did.
| C100 | C100 | C100 | LWS | LWS | LWS | IRAS | |
| Source | 60 |
100 |
120 |
60 |
100 |
120 |
|
| CRL 3068 | - | - | 70.0 | - | - | 67.0 | 1 |
| Y CVn | 21.0 | 10.5 | - | 14.6 | 8.3 | - | 1 |
| HD 161796 | - | - | 54.8 | - | - | 54.1 | 1 |
| R Cas | 102 | 38.5 | - | 85.5 | 32.9 | - | 2 |
|
IRAS 16342 |
- | - | 269 | - | - | 146 | 4 |
| OH104.9+2.4 | 84.5 | 63.0 | - | 89.2 | 44.6 | - | 5 |
|
|
92.8 | 50.5 | - | 82.3 | 36.6 | - | 5 |
|
|
112.5 | 64.0 | 177.5 | 108.5 | 52.9 | 39.0 | 5 |
| VX Sgr | - | - | 1240 | - | - | 205 | 6 |
| C200 | C200 | LWS | LWS | IRAS | |
| Source | 150 |
200 |
150 |
200 |
|
| CRL 3068 | 43.0 | 23.0 | 36.5 | 24.4 | 1 |
| Y CVn | 11.7 | 7.3 | 3.0 | 5.0 | 1 |
| HD 161796 | 31.2 | 17.2 | 17.4 | 19.1 | 1 |
| R Cas | 52.7 | 37.9 | 13.3 | 4.7 | 2 |
|
IRAS 16342 |
221 | 171 | 97.0 | 70.5 | 4 |
| OH104.9+2.4 | 246 | 270 | 33.2 | 35.3 | 5 |
|
|
161 | 136 | 33.3 | 46.8 | 5 |
|
|
179.5 | 147.5 | 25.8 | 18.3 | 5 |
| VX Sgr | 1640 | 1210 | 216 | 229 | 6 |
In Tables 6.2 and 6.3 the sources have been sorted according to the increasing value of the parameter CIRR2 as quoted in the IRAS Point Source Catalogue Version 2.1. This is a logarithmic function which describes the contamination expected from background cirrus emission at 100 ![]() m and responds to the equation:
m and responds to the equation:
where ![]() is the cirrus flux and F
is the cirrus flux and F![]() is the source flux (see the
IRAS Explanatory Supplement, [84]). A value of
CIRR2=1 corresponds to the cirrus flux being less than 1% of the source
flux while CIRR2 larger than 5-6 indicates that the flux measurement
is probably dominated by the cirrus contribution.
is the source flux (see the
IRAS Explanatory Supplement, [84]). A value of
CIRR2=1 corresponds to the cirrus flux being less than 1% of the source
flux while CIRR2 larger than 5-6 indicates that the flux measurement
is probably dominated by the cirrus contribution.
The cirrus contamination effect has clearly been detected in the
cross-calibration measurements shown in Tables 6.2 and 6.3, especially beyond 100 ![]() m.
m.
While the consistency between PHT-C and LWS is better than 20-30% in most
cases at 60 and 100 ![]() m (detector C-100), we can see that at longer
wavelengths (detector C-200) the situation becomes worse and
this good level of agreement is only reached by the sources
showing a very low value of the CIRR2 parameter (and not always).
For the rest of the sources in the short list under analysis the cirrus
contamination completely
dominates the flux detected at 120, 150 and 200
m (detector C-100), we can see that at longer
wavelengths (detector C-200) the situation becomes worse and
this good level of agreement is only reached by the sources
showing a very low value of the CIRR2 parameter (and not always).
For the rest of the sources in the short list under analysis the cirrus
contamination completely
dominates the flux detected at 120, 150 and 200 ![]() m. This is
clearly reflected by the fact that the flux ratios PHT-C/LWS at these
wavelengths
closely approach a constant value (between 6 and 8) which
is a pure consequence of the difference in size of effective apertures
between both instruments.
m. This is
clearly reflected by the fact that the flux ratios PHT-C/LWS at these
wavelengths
closely approach a constant value (between 6 and 8) which
is a pure consequence of the difference in size of effective apertures
between both instruments.
A similar analysis was carried out by Müller & Lagerros 2002, [127] using a combination of LWS01 grating scans and LWS02 fixed grating observations on a number of asteroids. For this cross-calibration comparison further processing of OLP Version 10 data products was performed using ISAP Version 2.0.
In the case of LWS01 grating scans the detector signals
were deglitched, ![]() -clipped (2.5
-clipped (2.5 ![]() r.m.s.) and averaged.
Detectors SW1 to SW5 were then smoothed with the nominal
resolution element of 0.29
r.m.s.) and averaged.
Detectors SW1 to SW5 were then smoothed with the nominal
resolution element of 0.29
![]() , LW1 to LW5 with a
resolution element of 0.6
, LW1 to LW5 with a
resolution element of 0.6
![]() and both scan
directions averaged. Observations on a large number of standard
sources (planets, asteroids, stars) have shown that the responsivities
of the detectors LW1, LW2 and LW3 might be flux dependent. In order to
correct for these suspected non-linearities
empirical correction values were derived and applied to the
asteroid scans (Müller 2001, [124]). The background
values were taken from COBE/DIRBE (Hauser et al. 1998a,
[75]) weekly maps (25-100
and both scan
directions averaged. Observations on a large number of standard
sources (planets, asteroids, stars) have shown that the responsivities
of the detectors LW1, LW2 and LW3 might be flux dependent. In order to
correct for these suspected non-linearities
empirical correction values were derived and applied to the
asteroid scans (Müller 2001, [124]). The background
values were taken from COBE/DIRBE (Hauser et al. 1998a,
[75]) weekly maps (25-100
![]() ) and yearly
maps (140-240
) and yearly
maps (140-240
![]() ).
LWS solid angles and correction factors for
extended sources were taken from the ISO Handbook Volume III on LWS,
[68]. Maximal background contributions were 4% for
Ceres and up to 50% for Hygiea with the
largest influence at long wavelengths.
).
LWS solid angles and correction factors for
extended sources were taken from the ISO Handbook Volume III on LWS,
[68]. Maximal background contributions were 4% for
Ceres and up to 50% for Hygiea with the
largest influence at long wavelengths.
For the fixed grating LWS02 observations the data reduction was also
performed manually taking only the last
100s of the measurements where the signals were usually
stabilised. Dark current subtraction and flux calibration
was done in the ISAP command mode. The detector non-linearities
and the backgrounds were corrected in the same way as for the LWS01 mode.
Maximal background contributions were up to 16% for Ceres,
up to about 10% for Pallas and Vesta and
up to 40% for Hygiea.
The dark current signals in LW4 (160.6
![]() ) and LW5
(178.0
) and LW5
(178.0
![]() ) were in many cases unstable during the integration
times and the corresponding fluxes could therefore not be used.
) were in many cases unstable during the integration
times and the corresponding fluxes could therefore not be used.
The ISOPHOT observations were calibrated against standard stars and planets only with the help of PIA, using `ad-hoc' Cal-G files excluding intentionally all the asteroids from them (they are also considered calibration standards for ISOPHOT), and treating the asteroid measurements this way as independent scientific observations.
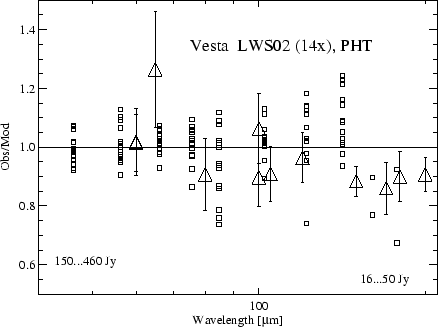
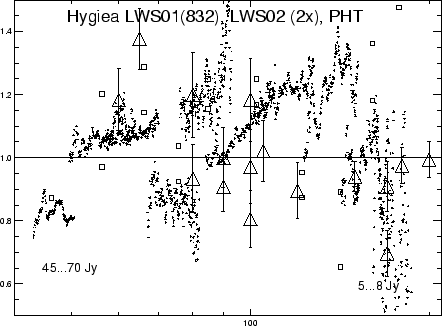
All these observations were compared with thermophysical models of the asteroids (Müller & Lagerros 2002, [127] and references therein), which consider aspects like size, albedo and shape together with the spin vector, a beaming model, thermal inertia and a wavelength-dependent emissivity.
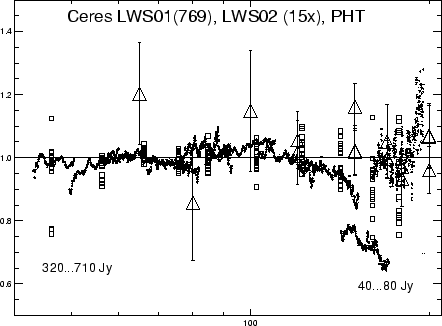
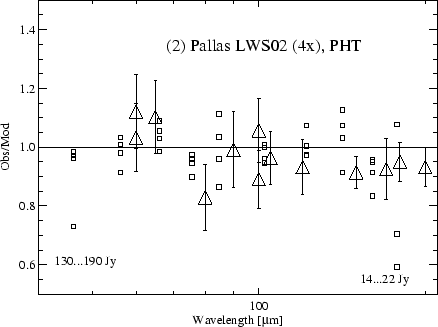
The observations/model ratios are shown in Figures 6.10 to 6.13. It may be interesting to remark here that this cross-calibration comparison comprises a large variety of observing geometries, aspect and phase angles, typically 2-3 orders of magnitude in flux and different background conditions for each asteroid. The observation from the 2 instruments (LWS, ISOPHOT) were taken in different observing modes (LWS01, LWS02, PHT22, PHT25, PHT99) and quite different integration times. They underwent completely different data processing and calibration schemes. Nevertheless, the observations/model representation gives a consistent picture, expressed in ratios close to one. In general no systematic offsets on absolute terms between the instruments or observing modes can be seen with the exception of the well known flux underestimation of the SW1 detector of LWS for observations taken before revolution 237 (some of which are represented in the plots as outliers), corrected in the final Version 10.1 of the LWS pipeline, and a few residual jumps betwen detector bands which are not yet fully understood.
|
|
|
|