Next: Discretionary Time Proposals Up: ISO INFO No. 11 Previous: Project Status
Proposal Statistics
The following statistics were collected after the end of Phase 2 data entry for the Supplemental Call. They refer to the entire data base, i.e. to programmes from the Main Call and the Supplemental Call. Figures 1 to 4 show the distribution of observing time per instrument and per observing mode. In each case, the distribution is expressed in terms of number of observations, and by observing time.
The average length of an observation is 19.7 minutes. However, the facility to concatenate two or more observations has been used rather extensively. Instead of 38126 observations, the mission planning has to deal with just over 19000 observation chains. This leads to a 39.4 min average observing block. Due to the skewness of the observation duration distribution, the median length of an observing block settles down to 23 min. Distributions are shown in figures 5 and 6.
Proposers have requested that a total of over 1700 observations be carried out at particular specified times (referred to as ``fixed time observations'').

Figure 1. Instrument usage by number of observations
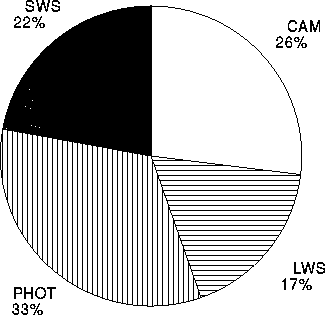
Figure 2. Instrument usage by time
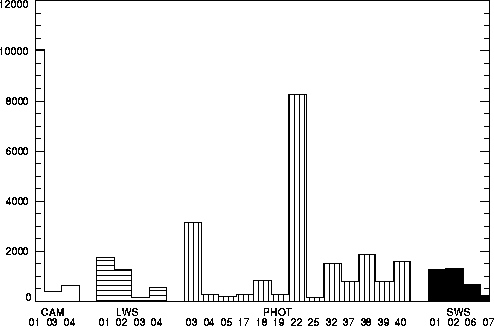
Figure 3. Number of observations per observing mode
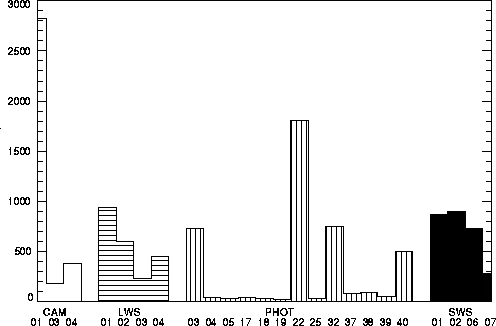
Figure 4. Total Time per observing mode
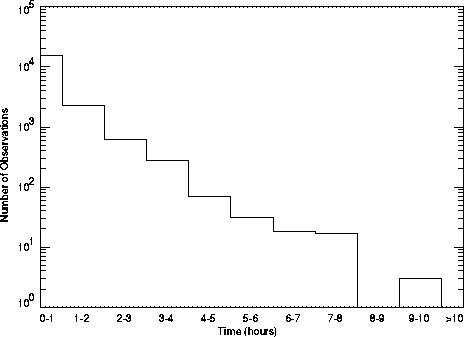
Figure 5. Distribution of the number of observations against
time for all observations
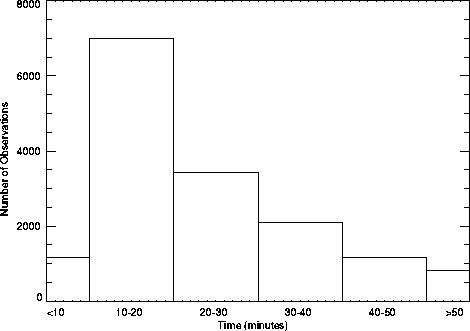
Figure 6. Distribution of number of observations against time
for observations of less than 1 hour
Editor: K. Leech