Date: 26-09-1996
ISO Cross Calibrations: A First Assessment
Status from mid September 1996A. Moneti, M.G. Breitfellner, A. Biviano, J. Blommaert, U. Kinkel, F. Lahuis, T. Lim, P.W. Morris, S.G. Schaeidt, B. Schulz
ISO Science Operations Centre, Astrophysics Division of ESA, P.O. Box 50727, E-28080 Madrid, Spain.
Summary:
We compare data on selected sources observed by two or more ISO instruments (or sub-instruments) in order to check for consistency in the calibration of the instruments. Where IRAS data are available, these are also compared to the ISO results. The results show that at this early stage of the mission the data sets are consistent to about at ± 30 % at lambda < 50 um, and somewhat higher at longer wavelengths where, however, the analysis is less complete. This analysis does not cover all the instrument modes and is limited to a restricted part of the dynamic range of the instruments, so that this result should not be taken as a general statement about ISO accuracy. Nevertheless, the overall agreement is considered very good at this stage and confirms that there are no serious problems in the calibration pedigrees of the instruments.
1. Introduction
Cross calibrations can be used to provide a simple consistency check among data obtained by different instruments on a given source. More precisely, such data must be consistent within the uncertainties specified by each instrument. Should this not be the case, then either (1) the uncertainties are underestimated, or (2) there is a problem with the calibration of one (or more) instruments.
The purpose of this memorandum is to demonstrate that overall calibration is consistent among the instruments, and thus to give users an extra degree of confidence in ISO data in general. For information about the calibration programs of the instruments, the reader is referred to the instrument papers in the A&A special issue on ISO results (Cesarsky et al. 1996, Clegg et al. 1996, Swinyard et al. 1996, Lemke et al. 1996, de Graauw et al. 1996, Schaeidt et al. 1996, and Valentijn et al. 1996).
In this memorandum we will compare the flux calibration of selected modes of the ISO instruments. The wavelength calibration of the spectrometers is discussed in Swinyard et al. (1996) and in Valentijn et al. (1996). This memorandum will not address the comparison between different modes of an instrument, which may be treated in the instrumental papers referenced above, nor will the uncertainties be analysed and compared, since the error budgets of the instruments are not fully quantified at this stage. The analysis presented here is based primarily on point sources, so that beam size effects need not be considered; a parallel analysis based on extended sources will be presented at a later time.
The ISO calibrations must also be consistent with those of other space missions, specifically IRAS and COBE-Dirbe. The ISO-IRAS comparison is very feasible, and it is performed here for those sources with IRAS data. The ISO-Dirbe comparison is complicated by the vastly different beam sizes (42' FWHM for Dirbe); while there are indications that the calibrations are consistent (Reach et al. 1996), more work on this is planned.
It must be stressed that the results presented here are by no means final: The calibrations of the individual instruments are not yet finalised and more calibration observations are being performed every week. These observations will help to monitor changes in the behavior of the instruments and keep them tuned. Furthermore, the techniques for data processing will certainly continue to evolve until well beyond the end of the mission and the uncertainties in the measurements can be expected to decrease.
A second purpose of cross calibrations is to use data from the instrument that achieves the highest accuracy to refine the calibration of the other ones. This will not be done here since the accuracies being reached at this time are not final.
2. Input Data and Reductions
Most of the observations were secured during the Performance Verification phase, when the core in-orbit calibration of the instruments was performed. In planning this phase, an effort was made to share calibration sources as much as possible, and as a result some of the sources discussed below were used for calibration purposes, though not necessarily for flux calibration. Other observations presented here were obtained as part of the science programme; these include the source K3-50 (Cox et al. private communication) and NGC7027 (Beintema et al. 1996).
While there are many sources in the ISO database that have been observed by more than one instrument, science observations tend to use the instruments in a complementary rather than in a redundant way. Consequently there are very few observations that can be used for our purposes in addition to the ones specifically planned as part of the calibration programmes. A further difficulty comes from the limited overlap in dynamic ranges of the spectrometeres with the photometers, so that there are very few sources which can be observed with one of the spectrometers at a high enough signal-to-noise ratio to be used for calibration, and which will not at the same time saturate the photometric instruments. This is especially true between CAM and SWS, and between PHT-C and LWS at the long wavelengths. As a consequence we could not present comparisons between these two pairs of instruments.
The data used are summarised below together with some information on the sources.
- HR7310 (delta Dra, Hic 94376, G9III):
CAM-CVF, PHT-P, and PHT-S calibration source- SWS spectrum (2.5-29 um)
- CAM-CVF spectrum (3-17 um)
- PHT-S spectrum (2.5-12 um)
- PHT-P filter (4.85 um, 11.5 um)
- GBPP-Kurucz model
- IRAS photometry
- HR7341 (Hic 94890, K1III):
CAM and PHT-P calibration source- CAM photometry (SW3, LW10)
- PHT-P filter (4.85 um, 11.5 um)
- GBPP-Kurucz model
- K3-50 (Compact HII region):
from science program- SWS full spectrum (2.5-45 um)
- LWS full spectrum (40-189 um)
- NGC 7027 (compact planetary nebula):
from science program- SWS spectrum (2.4-16.4 um)
- CAM-CVF spectrum (3-17 um)
- PHT-S spectrum (2.5-12 um)
At the time of reducing the data for this paper, not all pipeline products were scientifically fully validated. Thus, we used intermedeate pipeline results in most cases. Further processing was done manually using the Interactive Analysis (IA) packages of the instrument teams and following the procedures which will be used in the future version of the pipeline. These results are meant to be indicative of what the pipeline will be able to produce in the future.
In more details, data reduction proceeded as follows:
- CAM: Starting from Standard Processed Data (SPD), and using CAM-IA, the data have been deglitched, dark current subtracted, and flatfielded with sky flats obtained on bright regions of the Zodiacal light (these are ``library'' flats that have been obtained over the course of the mission so far). Synthetic aperture photometry was then used to extract the stellar signals, and these were converted to astrophysical flux units using CAM calibration tables (see Cesarsky et al. 1996, for details) which are included in the calibration files distributed on compact disk. The flux densities for the filter photometry are given at the central wavelengths of the filters, as given in the CAM Observers Manual, and assuming a spectrum where lambda * Flambda = const. ; colour correction was applied using a model spectrum of the star. In the case of the CVF, the spectral shape was corrected using a Relative Spectral Response Function (RSRF) obtained from HR7469 (F4V), which was also used to convert the spectrum to flux units.
- LWS: Auto-Analysis Results (AAR) data was used without further processing; this includes deglitching, dark current subtraction, wavelength calibration, and flux calibration. Both the absolute flux calibration and the RSRF are derived from Uranus.
- PHT: Manual processing starting with Edited Raw Data (ERD). This includes correction for non-linearity of the cold read-out electronics, deglitching, and subtraction of a sky background, which is treated in the same way. The detector signals are referenced to the internal illuminators whose output as a function of applied electrical power is calibrated using several calibration stars at short wavelengths, and asteroids, at long wavelengths. The original results are given as flux density assuming a flat spectrum (Fnu = const. ) at the filter ``central wavelength'' as defined in the PHT Observers Manual, and which is close to the filter effective wavelength. These were colour corrected using a model stellar spectrum. For PHT-S the processing proceeded in the same manner up to subtraction of the sky background. The RSRF and the conversion to absolute flux was obtained from several standard stars; the flux calibration of PHT-S does not use the internal illuminators.
- SWS: Manual processing starting from SPD-level data. This includes dark current subtraction, a delicate step especially in the case of low signals, correction by the RSRF, flux calibration, and averaging data in each instrumental band (defined by detectors and filters). All manual steps performed are consistent with those that will be performed in the final version of the pipeline. Note that the RSRF at the time of the reduction was determined partly from in-orbit and partly from ground-based measurements. Flux calibration is derived from several bright standard stars (Schaeidt et al. 1996).
3. Results and Discussion
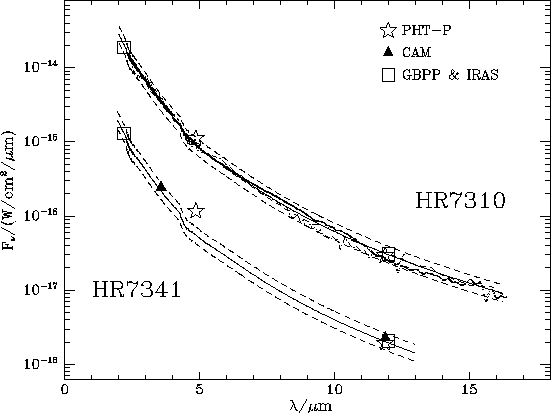
Fig. 1 compares data from various instruments on the two reference stars, HR7310 and HR7341, and also compares the ISO data with a photometric point from the Ground Based Preparatory Programme (Jourdain de Muizon & Habing 1992), the GBPP-Kurucz model, and the IRAS 12 um data. The dashedlines parallel to the model but displaced 0.11 dex above and below (i.e. model x 1.3 and model / 1.3) are used to indicate the range of the spread. Note that HR7341 was not used in deriving the SWS flux calibration, though it was used to check linearity. The figure shows quite good agreement among the short wavelength spectrometers, and reasonable agreement between the spectra and the photometry, with the exception of the PHT 4.85 um datum on HR7341. The reason for this discrepancy is not known at this time.

Fig. 1. Observations of HR7310 (top) and HR7341 (bottom) by several ISO (sub)instruments. The SWS spectrum appears as a thick line (actually a sequence of crosses), the CAM-CVF as a dashed line, and the PHT-S as a dot-dashed line. IRAS photometry and GBPP-Kurucz model is also plotted for comparison. See text for further details.
Fig. 2 compares K3-50 data from SWS, LWS, and IRAS. The region of overlap between the two instruments is very small, and both instruments have problems in that range: The SWS spectrum shows a bifurcation at lambda > 42 um, and the overall shape of the SWS spectrum over the lambda > 35 um range appears to become flat. The first effect is due to a difference in the upward and downward grating scans, and has been solved since the reduction of these data; the second might be attributed to the use of a ground-based RSRF in this spectral region which could differ by about 10 % from the in-orbit RSRF. This inaccuracy could also be one of the reasons for the peculiar shape of the SWS spectrum between 35 and 38 um, which is not yet understood. In LWS, the SW1 (and perhaps, to a lesser extent, also the SW2) detector drops considerably lower than expected; this happens occasionally for reasons that are not yet understood, but is not the norm. There is overall good agreement with the IRAS photometry, with SWS showing overall better agreement than LWS.

Fig. 2. SWS and LWS spectra of K3-50. The IRAS data are shown as asterisks for comparison. The plots are restricted to the region of overlap between the spectra and the IRAS data.
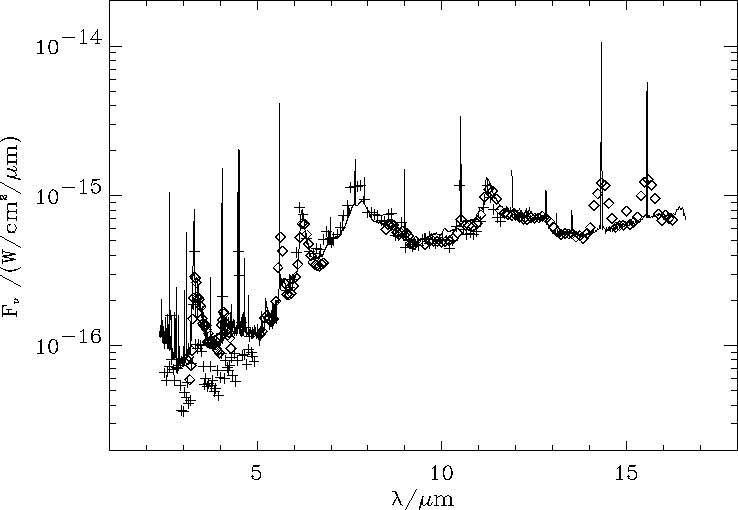
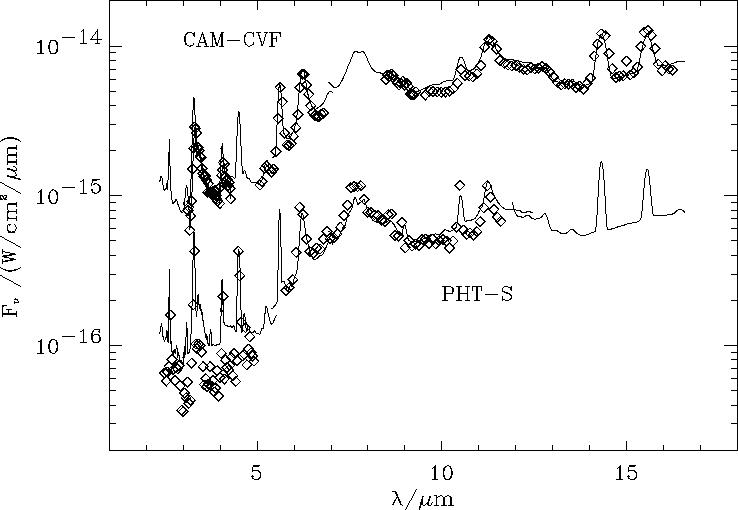
A more detailed comparison of the short wavelength spectrometers is presented in Figs. 3 and 4, where the spectrum of NGC7027 (Beintema et al. 1996) as observed by SWS, CAM-CVF, and PHT-S, is shown. In Fig. 3 the three spectra are shown superimposed; the CAM-CVF and PHT-S spectra are at their original resolution, the SWS spectrum at a resolution of 1000. In Fig. 4 the SWS spectrum was rebinned to the resolution of CAM-CVF and PHT-S, respectively. Overall the agreement is good to < 20 % except between PHT-S and the other two at lambda < 5, where the signal is lowest, and problems like dark current subtraction and the effects of transients become most serious. Fig. 4 also shows that there is good agreement in the line intensities.

Fig. 3. Spectra of the planetary nebula NGC7027 by SWS (solid line), CAM-CVF (diamonds), and PHT-S (+ signs).

Fig. 4.
Spectra of the planetary nebula NGC7027:
Upper trace: SWS (solid line) and CAM-CVF (diamonds)
Lower trace: SWS (solid line) and PHT-S (diamonds), shifted by 1 dex to avoid
confusion.
The SWS spectrum has been re-binned to the resolution
of the comparison instrument.
4. Conclusions
The main conclusion of this work is that the ISO calibration effort is on the right track. Observations by different instruments presented here agree to the 30 % level, at least for lambda < 50 um. This, however, should not be taken as a statement of the overall accuracy of the ISO calibration. First, only a selection of instrument modes have been considered: no analysis has been made of data obtained with the FPs, and line intensities obtained in different modes have not been compared in any detail. Second, all the sources used in this work are comparable in brightness to the calibrators; cross calibration on faint sources could reveal problems (e.g., linearity) in the extrapolation of the calibration to faint sources. Third, not all the sources used here are truly point sources: NGC7027 has a diameter of ~25" which will place it fully within the SWS and PHT-S beams (and in the CAM-CVF field of view) if the pointing was spot-on; but the ISO absolute pointing error is ± 3.5" (2 sigma), and this could bring part of the nebula to regions of lower sensitivity, and the nature of K3-50 at long wavelengths is less well known.
The agreement with IRAS is quite good as shown in the comparison of the two standard stars and of K3-50. The fact that the agreement is less good for lambda > 50 um than at the shorter wavelengths could point to a systematic offset in the LWS flux calibration, which is based on Uranus alone. Further comparison also with PHT-C data is necessary, but also systematic differences in the IRAS and ISO calibration pedigrees have to be considered.
Finally, it is important to restate that this is by no means the final word on the ISO calibrations and cross calibrations, but that it is a statement of where we are now, a bare six months into the Routine Operations Phase of the mission at the time of writing. There are still a lot to learn about the behavior of the detectors and the instruments, as well as about better data processing. Overall the ISO team finds it remarkable that the calibrations are in such good agreement at this early stage of the mission.
Acknowledgements. This work would not have been possible without the extensive work of many in the instrument teams who have developed the instruments, defined the calibration plans both in the laboratory and in orbit, executed those plans, and analysed the data.
- Beintema, D., et al. 1996, A&A, ISO special issue
- Cesarsky, C., et al. 1996, A&A, ISO special issue
- Clegg, P.E., Ade, P.A.R., Armand, C.,et al. 1996, A&A, ISO special issue
- de Graauw, T., et al. 1996, A&A, ISO special issue
- Kessler, M.F., Steinz, J.A, Anderegg, M.E, et al. 1996, A&A, ISO special issue
- Lemke, D., et al. 1996, A&A, ISO special issue
- Jourdain de Muizon, M. & Habing, H.J., 1992, Les Houches Series: Infrared Astronomy with ISO, p.129
- Reach, W.T., Abergel, A., Boulanger, F., et al. 1996, A&A, ISO special issue
- Schaeidt, S.G., Morris, P.W., Salama, A., et al. 1996, A&A, ISO special issue
- Swinyard, B.M., Clegg, P.E., Ade, et al. 1996, A&A, ISO special issue
- Valentijn, E.E., et al. 1996, A&A, ISO special issue
Calibration Liaison (MGB, AMo)