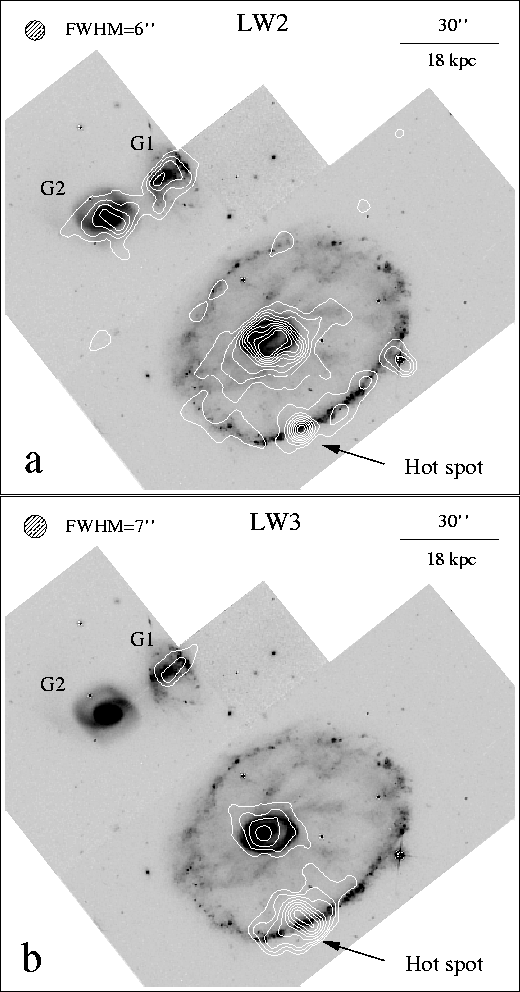
The Cartwheel: a) Contour map of the ISOCAM LW2 emission overlayed on a HST wide I band image. The contour levels are from 0.1 to 0.5 mJy/pixel with a step of 0.05 mJy/pixel. b) Contour map of the ISOCAM LW3 emission overlayed on the same HST image. The contour levels are 0.2, 0.3, 0.4, 0.6, 0.8, 1, 1.2 and 1.4 mJy/pixel. North is up and East is left in both images.
 Return to the