The First Results from 
M.F. Kessler
ISO Science Operations, Astrophysics Division, Villafranca, Spain.
This article is reprinted from the ESA Bulletin Nr. 86. It gives a summary of the in-orbit performance of ISO and its instruments and presents some of the initial scientific results.
Chronology of ISO Events
| 17-Nov-95 | Launch from Kourou at 02.20 CET |
|---|---|
| 19-Nov-95 | Perigee Raising Manoeuvre (from 500 km to 1000 km) |
| 21-Nov-95 | Start of "Satellite Commissioning Phase" |
| 24-Nov-95 | Apogee Lowering Manoeuvre - operational orbit attained |
| 27-Nov-95 | Ejection of "Cryo-cover" |
| 28-Nov-95 | First light with ISOCAM - M51 |
| 29-Nov-95 | First light with ISOPHOT - Gamma Draconis |
| 30-Nov-95 | First light with LWS - S106 |
| 01-Dec-95 | First light with SWS - Gamma Draconis |
| 08-Dec-95 | End of "Satellite Commissioning Phase" |
| 09-Dec-95 | Start of "Performance Verification Phase" |
| 03-Feb-96 | End of "Performance Verification Phase" |
| 04-Feb-96 | Start of "Routine Operations". |
Introduction

The Agency's Infrared Space Observatory (ISO) was given a picture-perfect launch by an Ariane 44P vehicle into its planned elliptical transfer orbit with lift-off from Kourou occurring at 02.20 CET on 17 November 1996.
The first 21 days after launch were devoted to the so-called "Satellite Commissioning Phase". During this period, the operational orbit was attained, the cover that had closed off the cryostat on the ground was ejected, the spacecraft was shown to be in excellent condition, "first light" for all instruments was achieved, engineering checks were successfully completed on all the four scientific instruments and the integrated ground segment was validated.
 N.B.: Click on any picure to view the larger image & its description
The next 56 days (i.e. from 8 December to 3 February) were devoted to the so-called "Performance Verification Phase", during which a detailed assessment of the in-flight performance of the scientific instruments was made, their core calibrations established and planned operating modes validated. The data acquired during this period are being used to verify the pipeline data processing and its products.
Table 1 summarises the main features of the ISO instruments. A set of 5 articles in ESA Bulletin issue number 84 (November 1995) gives a complete overview of the ISO programme.
| Instrument (Principal Investigator) | Main function | Wavelength (microns) |
|---|---|---|
| ISOCAM (C. Cesarsky, CEN-Saclay,F) | Camera and Polarimetry | 2.5 - 17 |
| ISOPHT (D. Lemke, MPI fur Astronomie Heidelberg, D) | Imaging photo-polarimeter | 2.5 - 240 |
| SWS (Th. de Graauw, Lab for Space Research, Groningen, NL) | Short-wavelength spectrometer | 2.4 - 45 |
| LWS (P. Clegg, Queen Mary & West Field College, London) | Long-wavelength spectrometer | 43 - 198 |
In-Orbit Performance
Ariane injected ISO into a transfer orbit with a perigee of 500 km and an apogee of 71600 km. The operational orbit (perigee of 1000 km and apogee 70600 Km) was achieved, as planned, with three uses of the hydrazine reaction control system, on 18 November (test burn and rehearsal), on 19 November (perigee raising manoeuvre) and on 24 November (apogee lowering manoeuvre). An estimated 50 kg of hydrazine remains on-board whereas only about 12 kg are needed for the planned ISO operations.
Second only to the launch in terms of tension was the release of the cryo-cover on 27 November. This cover closed the cryostat on the ground and had to be ejected before ISO could start its in-orbit mission. As the planned eject time approached, most of the staff at the operations centre in Villafranca were clustered around monitors showing the gyro outputs. There was a huge sigh of relief when these showed the recoil of the satellite as the cover was released. Shortly thereafter, the temperatures of the cryogenic system indicated that ISO was indeed, viewing cold space and about 30 minutes later the first star was found. ISO was in business!
The Satellite Commissioning Phase showed that the spacecraft status is excellent, with all subsystems performing above specifications. The cool-down of the satellite to reach its in-orbit equilibrium temperatures was well in line with the thermal model. The cryogenic system is providing the expected temperatures and the estimated mass flow rate of the boiled-off helium seems close to predictions. Current estimates are that ISO's in-orbit lifetime will be 24 +/- 2 months, compared to the design requirement of 18 months.
As far as the optical performance of ISO is concerned, images of point sources have been made with ISOCAM clearly showing the first Airy diffraction ring and, in some cases the second ring is also visible. Analysis of the data has shown that the ISO telescope is diffraction-limited at a wavelength of 15 microns. Measurements at shorter wavelengths have been made and the analysis is underway.
All nominal modes of the Attitude and Orbit Control system were successfully verified. The pointing performance is also substantially better than the specifications, as shown in table 2.
| Units | Spec. | Now | ||
|---|---|---|---|---|
| Relative Pointing Error (short term jitter) | 2 sigma, half cone, over 30 secs |
arc secs | < 2.7 | 0.5 |
| Absolute Pointing Drift | 2 sigma, half cone, | arc secs per hour | < 2.8 | < 0.1 |
| Absolute Pointing Error (blind pointing) | 2 sigma, half cone, | arc secs | <11.7 | 4-5 |
The Performance Verification Phase showed that the performance of the
instruments is also very good. All instruments are functioning very
well and as expected from ground-based tests. Particularly satisfying is that
all the cryo-mechanisms are fully operational - an initial anomaly with the
scanning mechanism of one of the Fabry-Perot units on the Long Wavelength
Spectrometer (LWS) has been successfully resolved.
The sensitivity of the instruments is affected to varying degrees by "glitches", caused by high energy cosmic ray particles impacting on the infrared detectors. These glitches result primarily in increased noise, but in some cases have necessitated modifications to instrument settings and recommendations for changes in observing strategy. ISOCAM's sensitivity is very close to pre-launch expectations. ISOPHOT, SWS and LWS are more affected and their sensitivities are less than originally predicted. The operating conditions of the detectors and the data processing algorithms are being optimised to maximise the instruments' performance. All instruments are returning scientific data of excellent quality and some examples of astronomical results are given in the next section.
By the end of the performance verification phase, 80% of the foreseen operating modes of the instruments had been commissioned and released for use by Guest Observers.
Prior to launch, it was estimated that the ISO instruments could be operated for about 16 hours per day, this being the period when ISO is outside the van Allen belts of trapped protons and electrons. However, post-launch data show that it is possible to operate the instruments for longer periods each day. Currently, the 'science window' has a duration of 16 hours and 43 minutes; a further extension for at least some of the instruments might be possible although sufficient data has not yet been gathered and analysed.
Routine operations started on 4 February as planned. Observers are currently tuning up their astronomical programmes to reflect the in-orbit performance of the satellite. ISO is now making an average of 50 observations per day for the worldwide astronomical community and shipment of these data on CD-ROMs to Observers has already started.
Initial Scientific Results
With new instruments, offering unprecedented combinations of wavelength
coverage, sensitivity, and spatial and spectral resolutions in the infrared
spectral region, ISO has been looking at familiar objects in unfamiliar ways.
A few of these measurements are presented here.
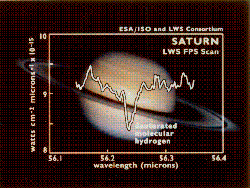
Starting close to home, ISO's spectrometers have been turning their gaze on the giant planet Saturn. A variety of molecules have been detected. Deuterated molecular hydrogen (HD) will give clues to the early history of Saturn, while the measurements of molecular hydrogen, phosphine and ammonia will permit deductions about the distribution of such materials at different depths in the atmosphere and about the "weather" and cloud formations on Saturn.
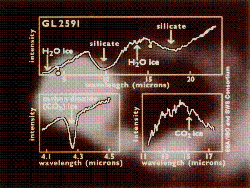
Staying with molecules and the spectrometers, the SWS observed a cloud called
GL2591. This cloud is wrapped around a newly-forming massive star
and hides the latter from telescopes viewing at visible
wavelengths. The SWS spectrum shows features due to water ice and to carbon
dioxide ice, including the first detection of the 4 micron CO_2 absorption
band.
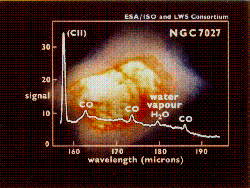
At the other end of the stellar evolution range, the LWS observed a
planetary nebulae, NGC 7027. This is a cloud of dust and gas, which has been
ejected by a star nearing the end of its life. It illustrates the process by
which the nuclear reactions in stars process hydrogen to heavier elements, which
are then returned to the interstellar gas at the end of a star's life to take
part in the next generation of star (and planet) formation. The great surprise
with this observation was the discovery of water vapour; this object is
carbon rich and the oxygen was thought to be tied up in carbon monoxide (CO)
rather than in water. Detections of these commonplace molecules - water and carbon
dioxide - are extremely difficult from the ground due to interference from the
Earth's atmosphere. However, knowledge of their abundances is crucial to an
understanding of the chemistry in space.
Massive stars end their lives in a supernova explosion, hurling processed
matter enriched with heavy elements back into the interstellar medium. As the
debris continues to expand outwards, it interacts with pre-existing clouds in
interstellar space and radiates at infrared wavelengths. ISOPHOT has made a map
of the supernova remnant MSH11-54, which shows striking similarities
and differences with X-ray maps of the same object.
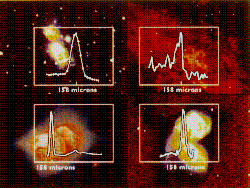 The LWS has been observing a "cosmic refrigerator" at work. Clouds of gas in
space radiate strongly at a wavelength of 158 microns, coming from singly
ionised ions of carbon, CII. This line has been detected before, but ISO sees it
easily in all kinds of places, in a cloud heated by bright stars,
around a dying star, in colliding galaxies, and most interestingly, in a cloud
of dust and gas (infrared cirrus) so cold that it can only be seen at infrared
wavelengths. The total energy released in this [CII] line, and lost to the
object, is enormous - up to 1 per mil of the total energy radiated by our
galaxy - and thus has a real cooling effect on the interstellar gas and dust from
which stars are born. Measurements such as these are essential to
understanding the energy balance in astronomical objects.
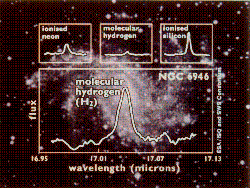
Turning to external galaxies, the SWS made the first detection of the 17 micron
line of molecular hydrogen in NGC 6946 and other external
galaxies, thereby opening a new way of tracking the distribution of the
molecular form of the most abundant element in the universe.
ISOPHOT has made a
map at a wavelength of 60 microns of the same galaxy showing an
intense hot spot at its centre caused by the rapid formation of very
hot stars.
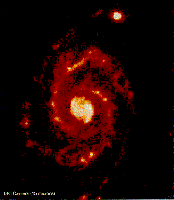
Moving fully to the topic of star formation, ISOCAM has made a series of
spectacular infrared images of the M51, also known as the Whirlpool galaxy.
Bright spots in the spiral arms correspond with warm dust clouds
where star formation is proceeding on a large scale. These are linked by
regions of cooler dust along the spiral arms and in the spaces between the arms
where previous generations of stars have left their debris. In the infrared, the
spiral arms can be traced right into the heart of the galaxy, where there are
hot spots of star formation on either side of a bright central nucleus. A
companion galaxy (top in figure) looks smaller than it does by visible light
because star-making is concentrated near its nucleus.
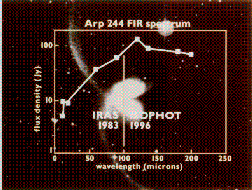
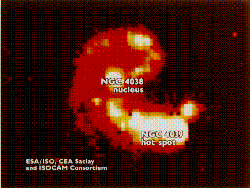
ISO's instruments have also looked at a pair of colliding galaxies, known as
'The Antennae', due to their characteristic shape at visible wavelengths, or -
more formally - as NGC4038/9 or Arp 244. ISOPHOT has taken a series of
measurements to determine the spectral shape of the energy distribution.
Such measurements demonstrate the width of the ISO spectral coverage and
can be used, inter alia, to determine rates of star formation.
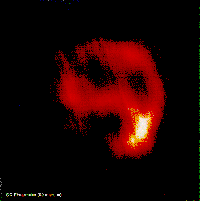
ISOCAM has
taken images at various wavelengths to localise the regions of star
formation. Clouds of dust and gas in the two galaxies have crashed together
and provoked bursts of star formation. In the lower galaxy (NGC4039) an
extended bright region, with a hot spot at the right, marks the overlap of the
disks and the position of intense star formation. In the upper galaxy, the
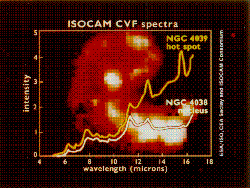
star making is concentrated around the central nucleus. ISOCAM has also taken
spectra of these objects to add another dimension to the
investigation of events 60 million light years away.
Conclusion
During its early months in orbit, ISO mainly looked at known objects to establish the performance of its instruments. However, even so, there were some pleasant scientific surprises. A vast quantity of high quality scientific data was returned and this is increasing by the day as ISO carries out an average of 50 observations per day. These few glimpses of early results from ISO are sound testimony to its potential and discovery-making power and it is now clear that the Observatory will meet the high scientific expectations laid on it by the worldwide scientific community.
Acknowledgements
The ISO success could not have been possible without the dedication, professionalism and inspiration of countless individuals over a period stretching back nearly 20 years. Overall management was carried out by the ESA Project Team, located at ESTEC. The satellite was built by an industrial consortium, led by Aerospatiale (F) as prime contractor, and including 35 companies at its peak. Each instrument was built by a consortium of institutes and industries, led by a Principal Investigator, Catherine Cesarsky (CEA, Saclay, F) for ISOCAM, Peter Clegg (QMW, London, UK) for the Long Wavelength Spectrometer, Thijs de Graauw, (SRON, Groningen, NL) for the Short Wavelength Spectrometer and Dietrich Lemke (MPIA, Heidelberg, D) for ISOPHOT. A full description of the participants in the ISO Programme is given in issue number 84 of the ESA Bulletin.
The smoothness with which the Satellite Commissioning and Performance Verification Phases were executed is a tribute to the expertise, enthusiasm and hard work of the teams at ESOC, Darmstadt and Villafranca, Spain. These teams contained ESA staff, personnel from industry, contractors, scientists and engineers from the instrument teams. Additional invaluable effort and support came from teams located at the 'home' institutes and companies. Without all this selfless effort, the results described in this article could not have ben achieved.
The data for the scientific results described in this article were obtained, reduced and analysed by members of the four instrument teams and of the Science Operations Centre.
