

Next: World Wide Web Up: Cover Page Previous: Proposal Statistics
Proposal Statistics: Figures
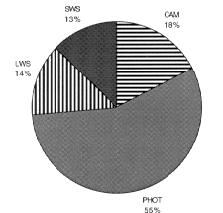
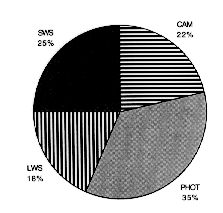
Fig. 1: Fig. 2: ISO Instrument usage/#observations ISO Instrument usage/time
Fig. 3: Number of observations / Observing Mode
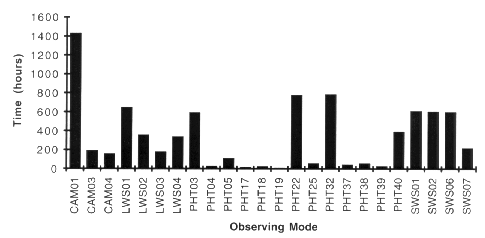
Fig. 4: Total Time / Observing Mode
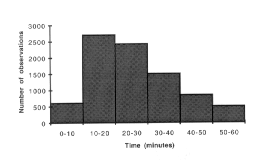
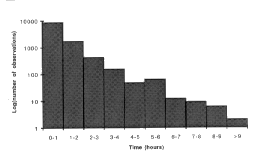
Fig. 5: Fig. 6: Distribution of #observations Distribution of #observations against time (observations < 1 hour) against time (for all observations)
Back to Proposal Statistics
